Administrators and, for that matter, typical users, often need to monitor servers for system resources like disk or CPU utilisation and other parameters to know how well the system is performing. There are many sophisticated system monitoring software such as Cacti, Munin and Nagios. Monitorix is a free, open source, lightweight system monitoring tool, designed to monitor many services and system resources.
Written in Perl, Monitorix has an inbuilt HTTP server. It consists of two programsa collector called monitorix, which is a Perl daemon that is started automatically like any other system service, and a CGI script called monitorix.cgi.
Features
Here is a list of Monitorixs main features. For a more complete list, refer to the official site.
- System load and system service demand
- CPU/GPU temperature sensors
- Disk temperature and health
- Network/port traffic and netstat statistics
- Mail statistics
- Web server statistics (Apache, Nginx, Lighttpd)
- MySQL load and statistics
- Squid proxy statistics
- NFS server/client statistics
- Raspberry Pi sensor statistics
- Memcached statistics
- Fail2ban statistics
- Monitors remote servers (Multihost)
- Enables users to view statistics in graphs or in plain text tables on a daily, weekly, monthly or yearly basis
- Offers the capability to zoom graphs for a better view
- Has the capability to define the number of graphs per row
Prerequisites
For this article, I have chosen CentOS 6.6, 64-bit version, with minimal installation, which is equivalent to Red Hat 6.6. The steps are the same on CentOS 7 with just a few modifications in the commands.
1. Check the status of SELinux by using the command sestatus. If it is not disabled, then turn off SELinux, simply by changing Enforcing to Disabled in the /etc/selinux/config file.
SELINUX=disabled
If it is in the enabled state, then graphs are not visible and you will get tons of error messages in the /var/log/messages or /var/log/audit/audit.log files about access denied to RRD database files.
Till rebooting the system, SElinux is in temporary disabled mode. After rebooting it is permanently get disabled.
2. Install the EPEL repository for extra package dependencies and enable it:
## RHEL/CentOS 6 64-Bit ##
# wget http://download.fedoraproject.org/pub/epel/6/x86_64/epel-release-6-8.noarch.rpm
#rpm -ivh epel-release-6-8.noarch.rpm
If it is not enabled, set enabled=1 in /etc/yum.repos.d/epel.repo
Installing Monitorix on RHEL/CentOS
Log in with root privileges. Download the monitorix rpm package, as follows:
#wget -c http://www.monitorix.org/monitorix-3.7.0-1.noarch.rpm
Install the required packages:
#yum install rrdtool rrdtool-perl perl-libwww-perl perl-MailTools perl-MIME-Lite perl-CGI perl-DBI perl-XML-Simple perl-Config-General perl-HTTP-Server-Simple perl-IO-Socket-SSL
Install monitorix rpm:
To install monitorix rpm using yum should be at the same path where rpm package is downloaded. Remaining at the same path where monitorix rpm downloaded, run below command:
#yum install monitorix-3.6.0-1.noarch.rpm
Start the Monitorix service:
#service monitorix start
To make Monitorix start at boot time, type:
#chkconfig --level 345 monitorix  on<a href="https://www.opensourceforu.com/?attachment_id=16172" rel="attachment wp-att-16172">
</a>
Configuration
The main configuration file is /etc/monitorix/monitorix.conf. Before changing parameters, take a backup of this file:
#cp -pRvf /etc/monitorix/monitorix.conf /etc/monitorix/monitorix.conf _org
We can change the various parameters like the title, hostname, authentication, host allow, host deny in the config file.
To make the changes, type:
title = <-------Set Title hostname = <----Set hostname <httpd_builtin> enabled = y host = port = 8080 <---------Set to required port user = nobody group = nobody log_file = /var/log/monitorix-httpd hosts_deny = <-------- Ip from which not to allow web link access hosts_allow = <-------- Ip from which to allow web link access <auth> enabled = n <--------- set to y msg = Monitorix: Restricted access htpasswd = /var/lib/monitorix/htpasswd <------------htpasswd file Location </auth> </httpd_builtin>
This is what you get after the changes are made:
title = diamond Monitorix
hostname =diamond
<httpd_builtin>
enabled = y
host = diamond
port = 8080
user = nobody
group = nobody
log_file = /var/log/monitorix-httpd
hosts_deny =
hosts_allow =
<auth>
enabled =  y
msg = Monitorix: Restricted access
htpasswd = /var/lib/monitorix/htpasswd
</auth>
</httpd_builtin>
To enable graph based statistics for a particular service, e.g., Apache, make the changes under # Graphs (de)activation section from n to y.
<graph_enable>
apache          = y
. </graph_enable>
And, finally, restart the Monitorix service whenever the changes are made to the config file.
#service monitorix restart
How to secure Monitorix
To secure Web link access with authentication, set enabled = y under the <auth> section and create a file /var/lib/monitorix/htpasswd
#touch  /var/lib/monitorix/htpasswd
#htpasswd -d /var/lib/monitorix/htpasswd   username
which will add a user with Force SHA encryption of the password.
Now point your browser to http://ip-address:8080/monitorix/
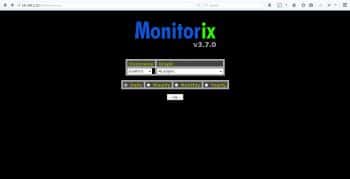
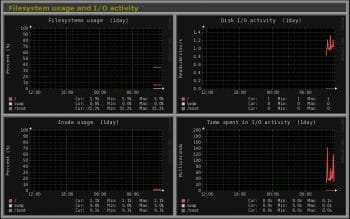
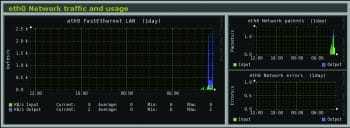
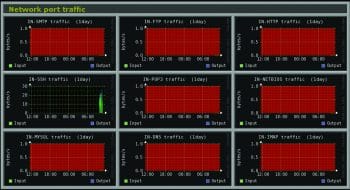
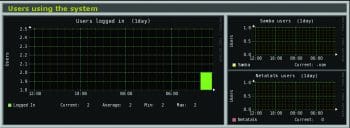
In our case, http://192.168.1.222:8080/monitorix, it will ask for the user name and password. After entering both, you will be able to see the Monitorix main page, as shown in Figure 1.
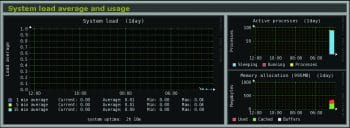
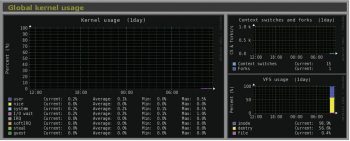
You can check out the screenshots given in Figures 2 to 7 for system statistics.
References
[1] Official site: http://www.monitorix.org/
[2] http://www.tecmint.com/how-to-enable-epel-repository-for-rhel-centos-6-5
[3] http://www.tecmint.com/monitorix-a-lightweight-system-and-network-monitoring-tool-for-linux/
[4] http://linux.die.net/man/5/monitorix.conf


