Repeated systematic failed attempts by a host to access resources like a URL, an IP address or an email address is known as fumbling. Erroneous attempts to access resources by legitimate users must not be confused with fumbling. Let’s look at how we can design an effective system for identifying network fumbling, to help keep our networks secure.
Network security implementation mainly depends on exploratory data analysis (EDA) and visualisation. EDA provides a mechanism to examine a data set without preconceived assumptions about the data and its behaviour. The behaviour of the Internet and the attackers is dynamic and EDA is a continuous process to help identify all the phenomena that are cause for an alarm, and to help detect anomalies in access to resources.
Fumbling is a general term for repeated systematic failed attempts by a host to access resources. For example, legitimate users of a service should have a valid email ID or user identification. So if there are numerous attempts by a user from a different location to target the users of this service with different email identifications, then there is a chance that this is an attack from that location. From the data analysis point of view, we say a fumbling condition has happened.
This indicates that the user does not have access to that system and is exploring different possibilities to break the security of the target. It is the task of the security personnel to identify the pattern of the attack and the mistakes committed to differentiate them from innocent errors. Let’s now discuss a few examples to identify a fumbling condition.
In a nutshell, fumbling is a type of Internet attack, which is characterised by failing to connect to one location with a systematic attack from one or more locations. After a brief discussion of this type of network intrusion, let’s consider a problem of network data analysis using R, which is a good choice as it provides powerful statistical data analysis tools together with a graphical visualisation opportunity for a better understanding of the data.
Fumbling of the network and services
In case of TCP fumbling, a host fails to reach a target port of a host, whereas in the case of HTTP fumbling, hackers fail to access a target URL. All fumbling is not a network attack, but most of the suspicious attacks appear as fumbling. The most common reason for fumbling is lookup failure which happens mainly due to misaddressing, the movement of the host or due to the non-existence of a resource. Other than this, an automated search of destination targets, and scanning of addresses and their ports are possible causes of fumbling. Sometimes, to search a target host, automated measures are taken to check whether the target is up and running. These types of failed attempts are generally mistaken for network attacks, though lookup failure happens either due to misconfiguration of DNA, a faulty redirection on the Web server, or email with a wrong URL. Similarly, SMTP communication uses an automated network traffic control scheme for its destination address search.
The most serious cause of fumbling is repeated scanning by attackers. Attackers scan the entire address-port combination matrix either in vertical or in horizontal directions. Generally, attackers explore horizontally, as they are most interested in exploring potential vulnerabilities. Vertical search is basically a defensive approach to identify an attack on an open port address. As an alternative to scanning, at times attackers use a hit-list to explore a vulnerable system. For example, to identify SSH host, attackers may use a blind scan and then start a password attack.
Identifying fumbling
Identifying malicious fumbling is not a trivial task, as it requires demarcating innocuous fumbling from the malevolent kind. Primarily, the task of assessing failed accesses to a resource is to identify whether the failure is consistent or transient. To explore TCP fumbling, look into all TCP communication flags, payload size and packet count. In TCP communication, the client sends an ACK flag only after receiving the SYN+ACK signal from the server. If there is no ACK after a SYN from the server, then that indicates a fumbling. Another possible way to locate a malicious attack is to count the number of packets of a flow. A legitimate TCP flow requires at least three packets of overhead before it considers transmitting data. Most retries require three to five packets, and TCP flows having five packets or less are likely to be fumbles.
Since, during a failed connection, the host sends the same SYN packets options repeatedly, a ration of packet size and packet number is also a good measure of identifying TCP flow fumbling.
ICMP informs a user about why a connection failed. It is also possible to look into the ICMP response traffic to identify fumbling. If there is a sudden spike in messages originating from a router, then there is a good chance that a target is probing the router’s network. A proper forensic investigation can identify a possible attacking host attacking host.
Since UDP does not follow TCP as a strict communication protocol, the easiest way to identify UDP fumbling is by exploring network mapping and ICMP traffic.
Identifying service level fumbling is comparatively easier than communication level fumbling, as in most of the cases exhaustive logs record each access and malfunction. For example, HTTP returns three-digit status codes 4xx for every client-side error. Among the different codes, 404 and 401 are the most common for unavailability of resources and unauthorised access, respectively. Most of the 404 errors are innocuous, as they occur due to misconfiguration of the URL or the internal vulnerabilities of different services of the HTTP server. But if it is a 404 scanning, then it may be malicious traffic and there may be a chance that attackers are trying to guess the object in order to reach the vulnerable target. Web server authentication is really used by modern Web servers. In case of discovering any log entry of an 401 error, proper steps should be taken to remove the source from the server.
Another common service level vulnerability comes from the mail service protocol, SMTP. When a host sends a mail to a non-existent address, the server either rejects the mail or bounces it back to the source. Sometimes it also directs the mail to a catch-all account. In all these three cases, the routing SMTP server keeps a record of the mail delivery status. But the main hurdle of identifying SMTP fumbling comes from spam. It’s hard to differentiate SMTP fumbling from spam as spammers send mail to every conceivable address. SMTP fumblers also send mails to target addresses to verify whether an address exists for possible scouting out of the target.
Designing a fumbling identification system
From the above discussion, it is apparent that identifying fumbling is more subjective than objective. Designing a fumbling identification and alarm system requires in-depth knowledge of the network and its traffic pattern. There are several network tools, but here we will cover some basic system utilities so that readers can explore the infinite possibilities of designing network intrusion detection and prevention systems of their own.
In order to separate malicious from innocuous fumbling, the analyst should mark the targets to determine whether the attackers are reaching the goal and exploring the target. This step reduces the bulk of data to a manageable state and makes the task easier. After fixing the target, it is necessary to examine the traffic to study the failure pattern. If it is TCP fumbling, as mentioned earlier, this can be detected by finding traffic without the ACK flag. In case of an HTTP scanning, examination of the HTTP server log table for 404 or 401 is done to find out the malicious fumbling. Similarly, the SMTP server log helps us to find out doubtful emails to identify the attacking hosts.
If a scouting happens to a dark space of a network, then the chance of malicious attack is high. Similarly, if a scanner scans more than one port in a given time frame, the chance of intrusion is high. A malicious attack can be confirmed by examining the conversation between the attacker and the target. Suspicious conversations can be subsequent transfers of files or communication using odd ports.
Some statistical techniques are also available to find the expected number of hosts of a target network that would be explored by a user, or to compute the likelihood of a fumbling attack test that could either pass or fail.
Capturing TCP flags
In a UNIX environment, a de facto packet-capturing tool is tcpdump. It is powerful as well as flexible. As a UNIX tool, a powerful shell script is also applicable over the outputs of tcpdump and can produce a filtered report as desired. The underlying packet-capturing tool of tcpdump is libcap and it provides the source, destination, IP address, port and IP protocol over the target network interface for each network protocol. For example, to capture TCP SYN packets over the eth0 interface, we can use the following command:
$ tcpdump –i eth0 “tcp[tcpflags] & (tcp-syn) !=0” –nn –v
Similarly, TCP ACK packets can be captured by issuing the command given below:
$tcpdump –I eth0 “tcp[tcpflags] & (tcp-ack) != 0” –nn –v
To have a combined capture report of SYN and ACK, both the flags can be combined as follows:
$tcpdump –I eth0 “tcp[tcpflags] & (tcp | tcp-ack) != 0” –nn –v
Getting network information
In this regard, netstat is a useful tool to get network connections, routing tables, interface statistics, masquerade connections, and multi-cast memberships. It provides a detailed view of the network to diagnose network problems. In our case, we can use this to identify ports that are listening. For example, to know about connections of HTTP and HTTPS traffic over TCP, we can use the following command expression with -l (to report socket), -p (to report relevant port) and –t (for only TCP) options.
$ netstat -tlp

Data analysis
Now, let’s discuss a network data analysis example on netstat command outcomes. This will help you to understand the network traffic to carry out intrusion detection and prevention.
Let’s say we have a csv file from the netstat command, as shown below:
> rfi <- read.csv(“rficsv.csv”,header=TRUE, sep=”,”)
…where the dimension, columns and object class are:
> dim(rfi)

[1] 302 11

> names(rfi)

[1] “ccadmin” “pts.0” “X” “ipaddress” “Mon” “Oct”

[7] “X30” X17.25” “X.1” “still” “logged.in”

> class(rfi)

[1] “data.frame”
To make the relevant column heading meaningful, the first and fourth column headings are changed to:
> colnames(rfi)[1]=’user’

> colnames(rfi)[4]=’ipaddress’
If we consider a few selective columns of the data frame, as shown here:
> c = c(colnames(rfi)[1],colnames(rfi)[2],colnames(rfi)[4],colnames(rfi)[5],colnames(rfi)[6],colnames(rfi)[7],colnames(rfi)[8])
…then the first ten rows can be displayed to have a view of the table structure, as shown in Figure 1.
> x = rfi[, c,drop=F]

> head(x,10)

user pts.0 ipaddress Mon Oct X30 X17.25

1 root pts/1 172.16.7.226 Mon Oct 30 12:48

2 ccadmin pts/0 172.16.5.230 Mon Oct 30 12:30

3 ccadmin pts/0 172.16.5.230 Wed Oct 25 10:22

4 root pts/1 172.16.7.226 Tue Oct 24 11:54

5 ccadmin pts/0 172.16.5.230 Tue Oct 24 11:53

6 (unknown :0 :0 Thu Oct 12 12:57

7 root pts/0 :0 Thu Oct 12 12:57

8 root :0 :0 Wed Oct 11 12:56

9 (unknown :0 :0 Wed Oct 11 12:55

10 reboot system 3.10.0-123.el7.x Thu Oct 12 12:37
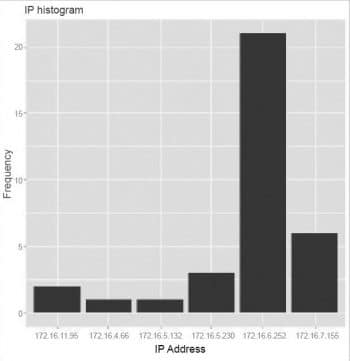
The data shows that the data frame is not in a uniform table format and fields of records are separated by a tab character. This requires some amount of filtering of data in the table to extract relevant rows for further processing. Since I will be demonstrating the distribution of IP addresses within a system, only the IP address and other related fields are kept for histogram plotting.
To have a statistical evaluation of this data, it is worth removing all the irrelevant fields from the data frame:
drops = c(colnames(rfi)[2],colnames(rfi)[3],colnames(rfi)[5],colnames(rfi)[6],colnames(rfi)[7],colnames(rfi)[8],colnames(rfi)[9],colnames(rfi)[10],colnames(rfi)[11])

d = rfi[ , !(names(rfi) %in% drops)]
Then, for simplicity, extract all IP addresses attached to the user ‘ccadmin’ which start with ‘172’.
u = d[like(d$user,’ccadmin’) & like(d$ipaddress,’172’),]
Now the data is ready for analysis. The R summary command will show the count of elements of each field, whereas the count command will show the frequency distribution of the IP address as shown below:
> summary(u)

user ipaddress

ccadmin :34 172.16.6.252:21

: 0 172.16.7.155: 6

(unknown : 0 172.16.5.230: 3

backup_u : 0 172.16.11.95: 2

reboot : 0 172.16.4.66 : 1

root : 0 172.16.5.132: 1

(Other) : 0 (Other) : 0

and

> count(u)

user ipaddress freq

1 ccadmin 172.16.11.95 2

2 ccadmin 172.16.4.66 1

3 ccadmin 172.16.5.132 1

4 ccadmin 172.16.5.230 3

5 ccadmin 172.16.6.252 21

6 ccadmin 172.16.7.155 6
For better visualisation, this frequency distribution of the IP address can be depicted using a histogram, as follows:
qplot(u$ipaddress,main=’IP histogram’,xlab=’BioMass of Leaves’,ylab=’Frequency’)


