This article gives the reader a bird’s eye view of machine learning models, and solves a use case through Sframes and Python.
‘Data is the new oil’—and this is not an empty expression doing the rounds within the tech industry. Nowadays, the strength of a company is also measured by the amount of data it has. Facebook and Google offer their services free in lieu of the vast amount of data they get from their users. These companies analyse the data to extract useful information. For instance, Amazon keeps on suggesting products based on your buying trends, and Facebook always suggests friends and posts in which you might be interested. Data in the raw form is like crude oil—you need to refine crude oil to make petrol and diesel. Similarly, you need to process data to get useful insights and this is where machine learning comes handy.
Machine learning has different models such as regression, classification, clustering and similarity, matrix factorisation, deep learning, etc. In this article, I will briefly describe these models and also solve a use case using Python.
Linear regression: Linear regression is studied as a model to understand the relationship between input and output numerical values. The representation is a linear equation that combines a specific set of input values (x), the solution to which is the predicted output for that set of input values. It helps in estimating the values of the coefficients used in the representation with the data that we have available. For example, in a simple regression problem (a single x and a single y), the form of the model is:
y = B0 + B1*x
Using this model, the price of a house can be predicted based on the data available on nearby homes.
Classification model: The classification model helps identify the sentiments of a particular post. For example, a user review can be classified as positive or negative based on the words used in the comments. Given one or more inputs, a classification model will try to predict the value of one or more outcomes. Outcomes are labels that can be applied to a data set. Emails can be categorised as spam or not, based on these models.
Clustering and similarity: This model helps when we are trying to find similar objects. For example, if I am interested in reading articles about football, this model will search for documents with certain high-priority words and suggest articles about football. It will also find articles on Messi or Ronaldo as they are involved with football. TF-IDF (term frequency – inverse term frequency) is used to evaluate this model.
Deep learning: This is also known as deep structured learning or hierarchical learning. It is used for product recommendations and image comparison based on pixels.
Now, let’s explore the concept of clustering and similarity, and try to find out the documents of our interest. Let’s assume that we want to read an article on soccer. We like an article and would like to retrieve another article that we may be interested in reading. The question is how do we do this? In the market, there are lots and lots of articles that we may or may not be interested in. We have to think of a mechanism that suggests articles that interest us. One of the ways is to have a word count of the article, and suggest articles that have the highest number of similar words. But there is a problem with this model as the document length can be excessive, and other unrelated documents can also be fetched as they might have many similar words. For example, articles on football players’ lives may also get suggested, which we are not interested in. To solve this, the TF-IDF model comes in. In this model, the words are prioritised to find the related articles.
Let’s get hands-on for the document retrieval. The first thing you need to do is to install GraphLab Create, on which Python commands can be run. GraphLab Create can be downloaded from https://turi.com/ by filling in a simple form, which asks for a few details such as your name, email id, etc. GraphLab Create has the IPython notebook, which is used to write the Python commands. The IPython notebook is similar to any other notebook with the advantage that it can display the graphs on its console.Open the IPython notebook which runs in the browser at http://localhost:8888/. Import GraphLab using the Python command:
import graphlab
Next, import the data in Sframe using the following command:
peoples = graphlab.SFrame(‘people_wiki.gl/’) .
To view the data, use the command:
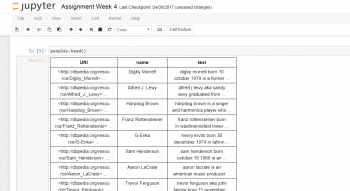
peoples.head()
This displays the top few rows in the console.
The details of the data are the URL, the name of the people and the text from Wikipedia.
I will now list some of the Python commands that can be used to search for related articles on US ex-President Barack Obama.
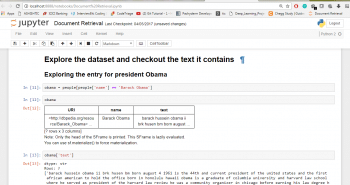
1. To explore the entry for Obama, use the command:
obama = people[people[‘name’] == ‘Barack Obama’]
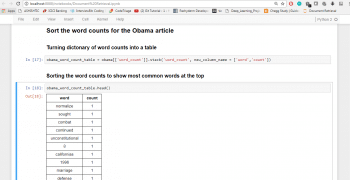
2. Now, sort the word counts for the Obama article. To turn the dictionary of word counts into a table, give the following command:
obama_word_count_table = obama[[‘word_count’]].stack(‘word_count’, new_column_name = [‘word’,’count’])
3. To sort the word counts to show the most common words at the top, type:
obama_word_count_table.head()
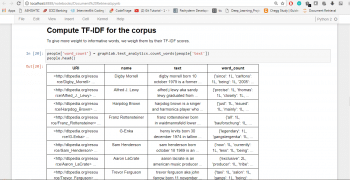
4. Next, compute the TF-IDF for the corpus. To give more weight to informative words, we evaluate them based on their TF-IDF scores, as follows:
people[‘word_count’] = graphlab.text_analytics.count_words(people[‘text’])

people.head()
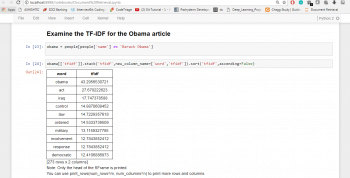
5. To examine the TF-IDF for the Obama article, give the following commands:
obama = people[people[‘name’] == ‘Barack Obama’]

obama[[‘tfidf’]].stack(‘tfidf’,new_column_name=[‘word’,’tfidf’]).sort(‘tfidf’,ascending=False)
Words with the highest TF-IDF are much more informative. The TF-IDF of the Obama article brings up similar articles that are related to it, like Iraq, Control, etc.
Machine learning is not a new technology. It’s been around for years but is gaining popularity only now as many companies have started using it.


