Icinga is an open source network monitoring tool for infrastructure of all sizes. It has an integrated cluster system secured via SSL. It keeps a watch over networks as well as other resources, notifies the user of errors and recoveries, and generates performance data for reporting.
In order to build up networks in small or large organisations, systems and network administrators start with the design and analyse process, before choosing the specific hardware that meets the requirements of the organisation. Many companies need their network to be up and functioning to generate revenue, so having the right set of tools to monitor, manage and administrate it is critical.
Today, various commercial, freeware and open source tools are available to choose from. So the debate continues about which tool to choose, and whether that tool has the features that meet the organisation’s monitoring requirements. Network monitoring is a highly sensitive administrative task. It gives administrators a clear view of devices, services and applications running in the network, apart from the opportunity to track the availability and performance of resources. This enables proactive management rather than reacting to issues after they happen.
There are various excellent open source network monitoring tools like Nagios, Zabbix, Libre NMS, Icinga 2 and Pandora FMS, but it is also possible to monitor networks manually. The latter option depends on the size of the network and how critical the resources on the network are. The safest choice is to deploy one of the best network monitoring solutions—Icinga 2, on Ubuntu 17.10.
Icinga 2
In 2009, a group of developers from the Nagios community announced a fork called Icinga because they were dissatisfied with the features of Nagios software. Icinga developers released separate versions—Icinga Core, Icinga API and Icinga Web. In the following year, Icinga integrated the Icinga API component into Icinga Web and improvised SLA reporting. In 2012, the Icinga project released a technology preview of the core framework replacement and a parallel development branch called Icinga 2.
Icinga is an open source network monitoring tool that enables network administrators to monitor infrastructure of all sizes, with their integrated cluster system secured via SSL. It checks hosts and services and notifies users of their status. Icinga has a more agile development cycle than Nagios. It is an enterprise grade open source monitoring system which keeps a watch over networks as well as other network resources, notifies the user of errors and recoveries, and generates performance data for reporting. Scalable and extensible, Icinga can monitor complex, large environments over dispersed locations.
The following reasons ensure Icinga 2 remains one of the most popular open source network monitoring solutions:
- Good, stable and error-free code
- Interoperability with external interfaces
- High scalability
- Clean and clear—object based configuration
- Dynamic notifications
- All sorts of network logs
- Performs all sorts of service and agent-based checks
Features
Because of its regular agile based development, Icinga provides much better features than Nagios, apart from additional modules like improved SLA accuracy, and good database connections for PostgreSQL and Oracle in terms of network monitoring.
The following points highlight the unique features of the Icinga 2 network monitoring tool.
- Extensive monitoring: Icinga’s network monitoring coverage is extensive in terms of network services, which include SMTP, POP3, HTTP, NNTP, Ping, etc. Icinga 2 also monitors host resources (CPU and disk utilisation, etc) and servers (all sensors, routers, switches, etc). It performs parallel service checks, and its simple front-end design helps administrators monitor the devices as per their unique requirements. Icinga 2 also supports Graphite and InfluxDB.
- High performance and distributed: Icinga 2 is very fast and can perform thousands of checks without any excessive CPU utilisation. It can combine high level clusters with distributed steps, and presents the complex network structure in a very simple way.
- REST API: With the support of RESTful API, Icinga 2 can update all sorts of configurations in real-time. Access control is highly configured and supports lots of functions, as per the number of users.
- Interfaces: Users can choose any of two interfaces like Classic UI and Icinga Web.
- Innumerable modules: Icinga 2 is bundled with many modules to provide advanced network monitoring and administration like Icinga Director, Business Process, Cube, Graphite, Elastic Search and Generic TTS, as well as other community modules like Grafana, Maps, PNP, etc.

Installing and deploying Icinga 2 and Icinga Web 2 on Ubuntu 17.10
Preparing your system
Before installing and configuring Icinga 2 and Icinga Web 2, you need the following:
a. A machine running Ubuntu 17.10
b. An IP address like 192.168.1.100
c. All the installations of Icinga 2 and Icinga Web 2 done as the root user or as a user who is part of the sudo group
Part 1: Command based configuration of Icinga 2 and Icinga Web 2
Step 1: Update the repositories
In order to facilitate the installation of the latest version, it is very important to update the machine. Use the following command to update the repositories:
#apt-get update
Step 2: Install the Net-tools package
To issue some network related commands on the console, like ifconfig-, in order to view the IP address, the Net-tools package is required. To install Net-tools, issue the following command:
#apt-get install net-tools
Step 3: Install the LAMP server
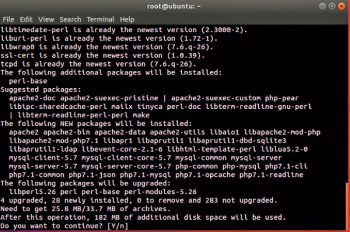
We need to have a machine with the LAMP server for the installation of Icinga 2. To create/install/deploy the LAMP server, issue the following command:
#apt-get install lamp-server^
This single command will make your Ubuntu machine a LAMP server and install Apache, MySQL and PHP 7.1.
Press ‘y’ and Ubuntu will download all packages and install Apache, MySQL and PHP, and even configure everything. During the installation, users will be prompted to enter the MySQL password. Enter the secure password twice to set up and continue to the next step.
Step 4: Install Icinga 2 and Icinga2-ido-mysql
After the installation of the LAMP server, the machine is all set to run and deploy the Icinga 2 monitoring solution.
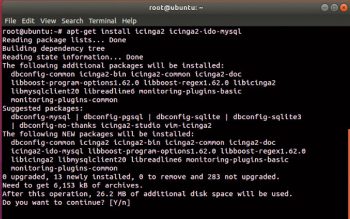
The following command will install the main Icinga software as well as a database driver that enables Icinga to put historical data and other information into a MySQL database.
#apt-get install icinga2 icinga2-ido-mysql
Press ‘y’ to start the installation.
During the installation, you will be presented with the following questions:
- Enable Icinga 2’s Ido-mysql feature?
Select ‘Yes’ and press Enter.
- Configure database for Icinga2-ido-mysql with dbconfig-common?
Select ‘Yes’ and press Enter.
You will be prompted to create the Icinga database password. Type in any password of your choice and this will be used for setting up Icinga 2 at the front-end and even the Web interface.
With the above steps, the initial setup and configuration process of Icinga 2 is complete. And now, the machine is all set to enable some features.
Step 5: Enable Icinga2 MySQL features
In order to enable the Icinga 2 MySQL features, issue the following commands:
#icinga2 feature enable ido-mysql

#icinga2 feature enable command
In order to save the changes and make sure that no errors occur over the next steps, you need to restart Icinga 2 to proceed with the subsequent installation steps.
#systemctl restart icinga2
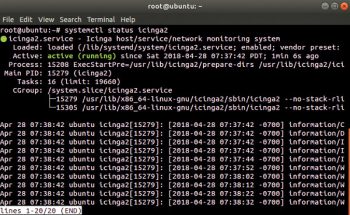
Step 6: In order to ensure that Icinga 2 is up and running, we can check its status by using the following command:
#systemctl status icinga2
The green signal in Figure 3 confirms that the configuration has been done successfully and Icinga 2 is up and running. Now we are all set for the front-end Web based configuration.
Step 7: Installing the Icinga 2 Web interface
In order to help network administrators easily monitor the network and all the devices, the most important module available, in addition to Icinga 2, is Icinga 2 Web.
The following command installs the Icinga 2 Web interface:
#apt-get install icingaweb2
Press ‘y’ to start the installation.
Step 8: Editing the php.ini file for time zone configuration
In order to ensure that the Web interface-based installation doesn’t give any errors, the most important part is to edit the php.ini file and set the time zone. Issue the following command to open the php.ini file in the NANO editor:
#nano /etc/php/7.1/apache2/php.ini
Now go to the Time Zone setting, set remove ‘;’ to active and type the zone name, i.e., the country and city in which you are residing, to complete the command based configuration (for example: Asia/Ho_Chi_Minh). Press Control x before saving and exiting the editor.
Part 2: Web based configuration of Icinga 2 and Icinga Web 2
In order to start using Icinga Web for network monitoring, it is important to configure the Icinga 2 Web interface using a Web based process. And before proceeding with opening the website, a setup token is required.
Step 9: Creating a setup token
In order to generate the token, issue the following command:
#icingacli setup token create
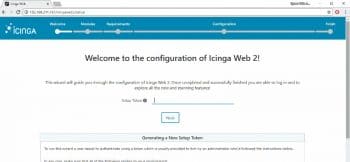
Step 10: Start the Web interface link to finalise the next installation and configure Icinga for network monitoring. Open the following link in the Web browser: http://<ipaddress>/icingaweb2/setup
Step 11: Type the token in the ‘Set up token’ space, and click ‘Next’.
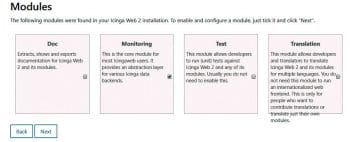
Step 12: Enable the monitoring module and click ‘Next’.
Step 13: In order to ensure that the setup continues in the proper manner, without any errors, verify the PHP setting and click ‘Next’ to continue.
Step 14: Select ‘Authenticating Method’ as the database to access Icinga Web 2, configure specific backup details and click ‘Next’.
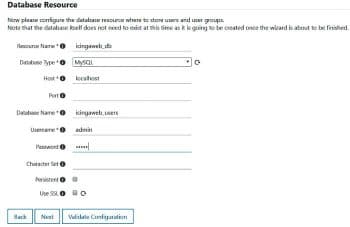
Step 15: In order to ensure that Icinga 2 connects to the MySQL database, fill in the necessary details as follows:
- Database type: MySQL
- Host: ‘Hostname’ or Localhost (if any hostname) or ‘Server name’
- Database name: icingaweb_users
- Username: admin
- Password: Type the password created while setting up Icinga. Then click ‘Next’ to proceed.
Step 16: After entering the database configuration details, set up the database. Enter the following details.
Username: root
Password: This has been created during the initial setting up of the Icinga database installation.
Step 17: Select ‘Authentication backend’. Then type icingaweb2, and click Next.
Step 18: To create Icinga 2 Web administration user logins, type the following information.
Username: admin
Password: Any password of your choice
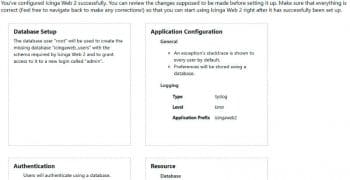
Step 19: To perform ‘Application Configuration’, choose the preferred storage type, application prefix and facility. Then click Next to continue.
Step 20: After making all the above settings, Icinga 2 can help administrators to review them. If all is fine, click Next, or the user can go back to make any changes needed in the settings.
Step 21: Configure the monitoring module for Icinga Web 2. Click Next to continue.
Step 22: To configure the monitoring backend, get the default values selected and click Next to continue.
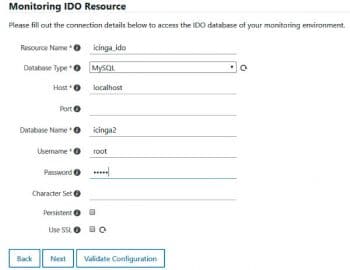
Step 23: To configure the monitoring IDO resource, type the following details.
Database type: MySQL
Host: Localhost
Database name: icinga2
Username: root
Password: Type the one created by the user during setup
Click on ‘Validate configuration’ to check, and then on ‘Next’ to continue.
Step 24: In the next window, the user will be greeted with Command Transport. Click Next to continue.
Step 25: Configure monitoring security. Click Next to continue.
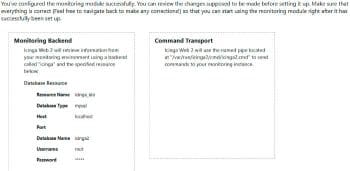
Step 26: In the next window, administrators can review all the monitoring module configuration options (Figure 10). If all is okay, click Next, or you can go back to any option for any sort of change.
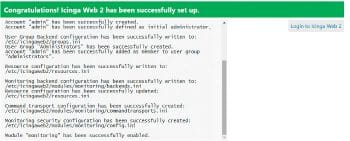
On clicking Next, the window shown in Figure 11 will confirm the successful installation of Icinga 2 and Icinga Web 2 on Ubuntu 17.10.
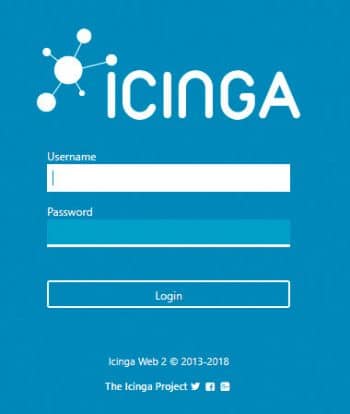
Step 27: Icinga 2 Icinga Web 2 ready are now ready to be launched. Figure 12 shows the Home Page of the Icinga Web 2 monitoring solution.
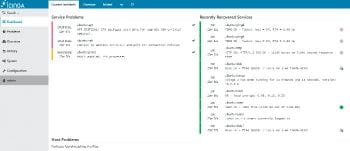
Step 28: Type the username as ‘Admin’ followed by the password and click ‘Login’. You will be presented with the dashboard of Icinga Web 2 on which you can start with network monitoring.
Icinga 2 and Icinga Web 2 have now been successfully configured on Ubuntu 17.10.


