


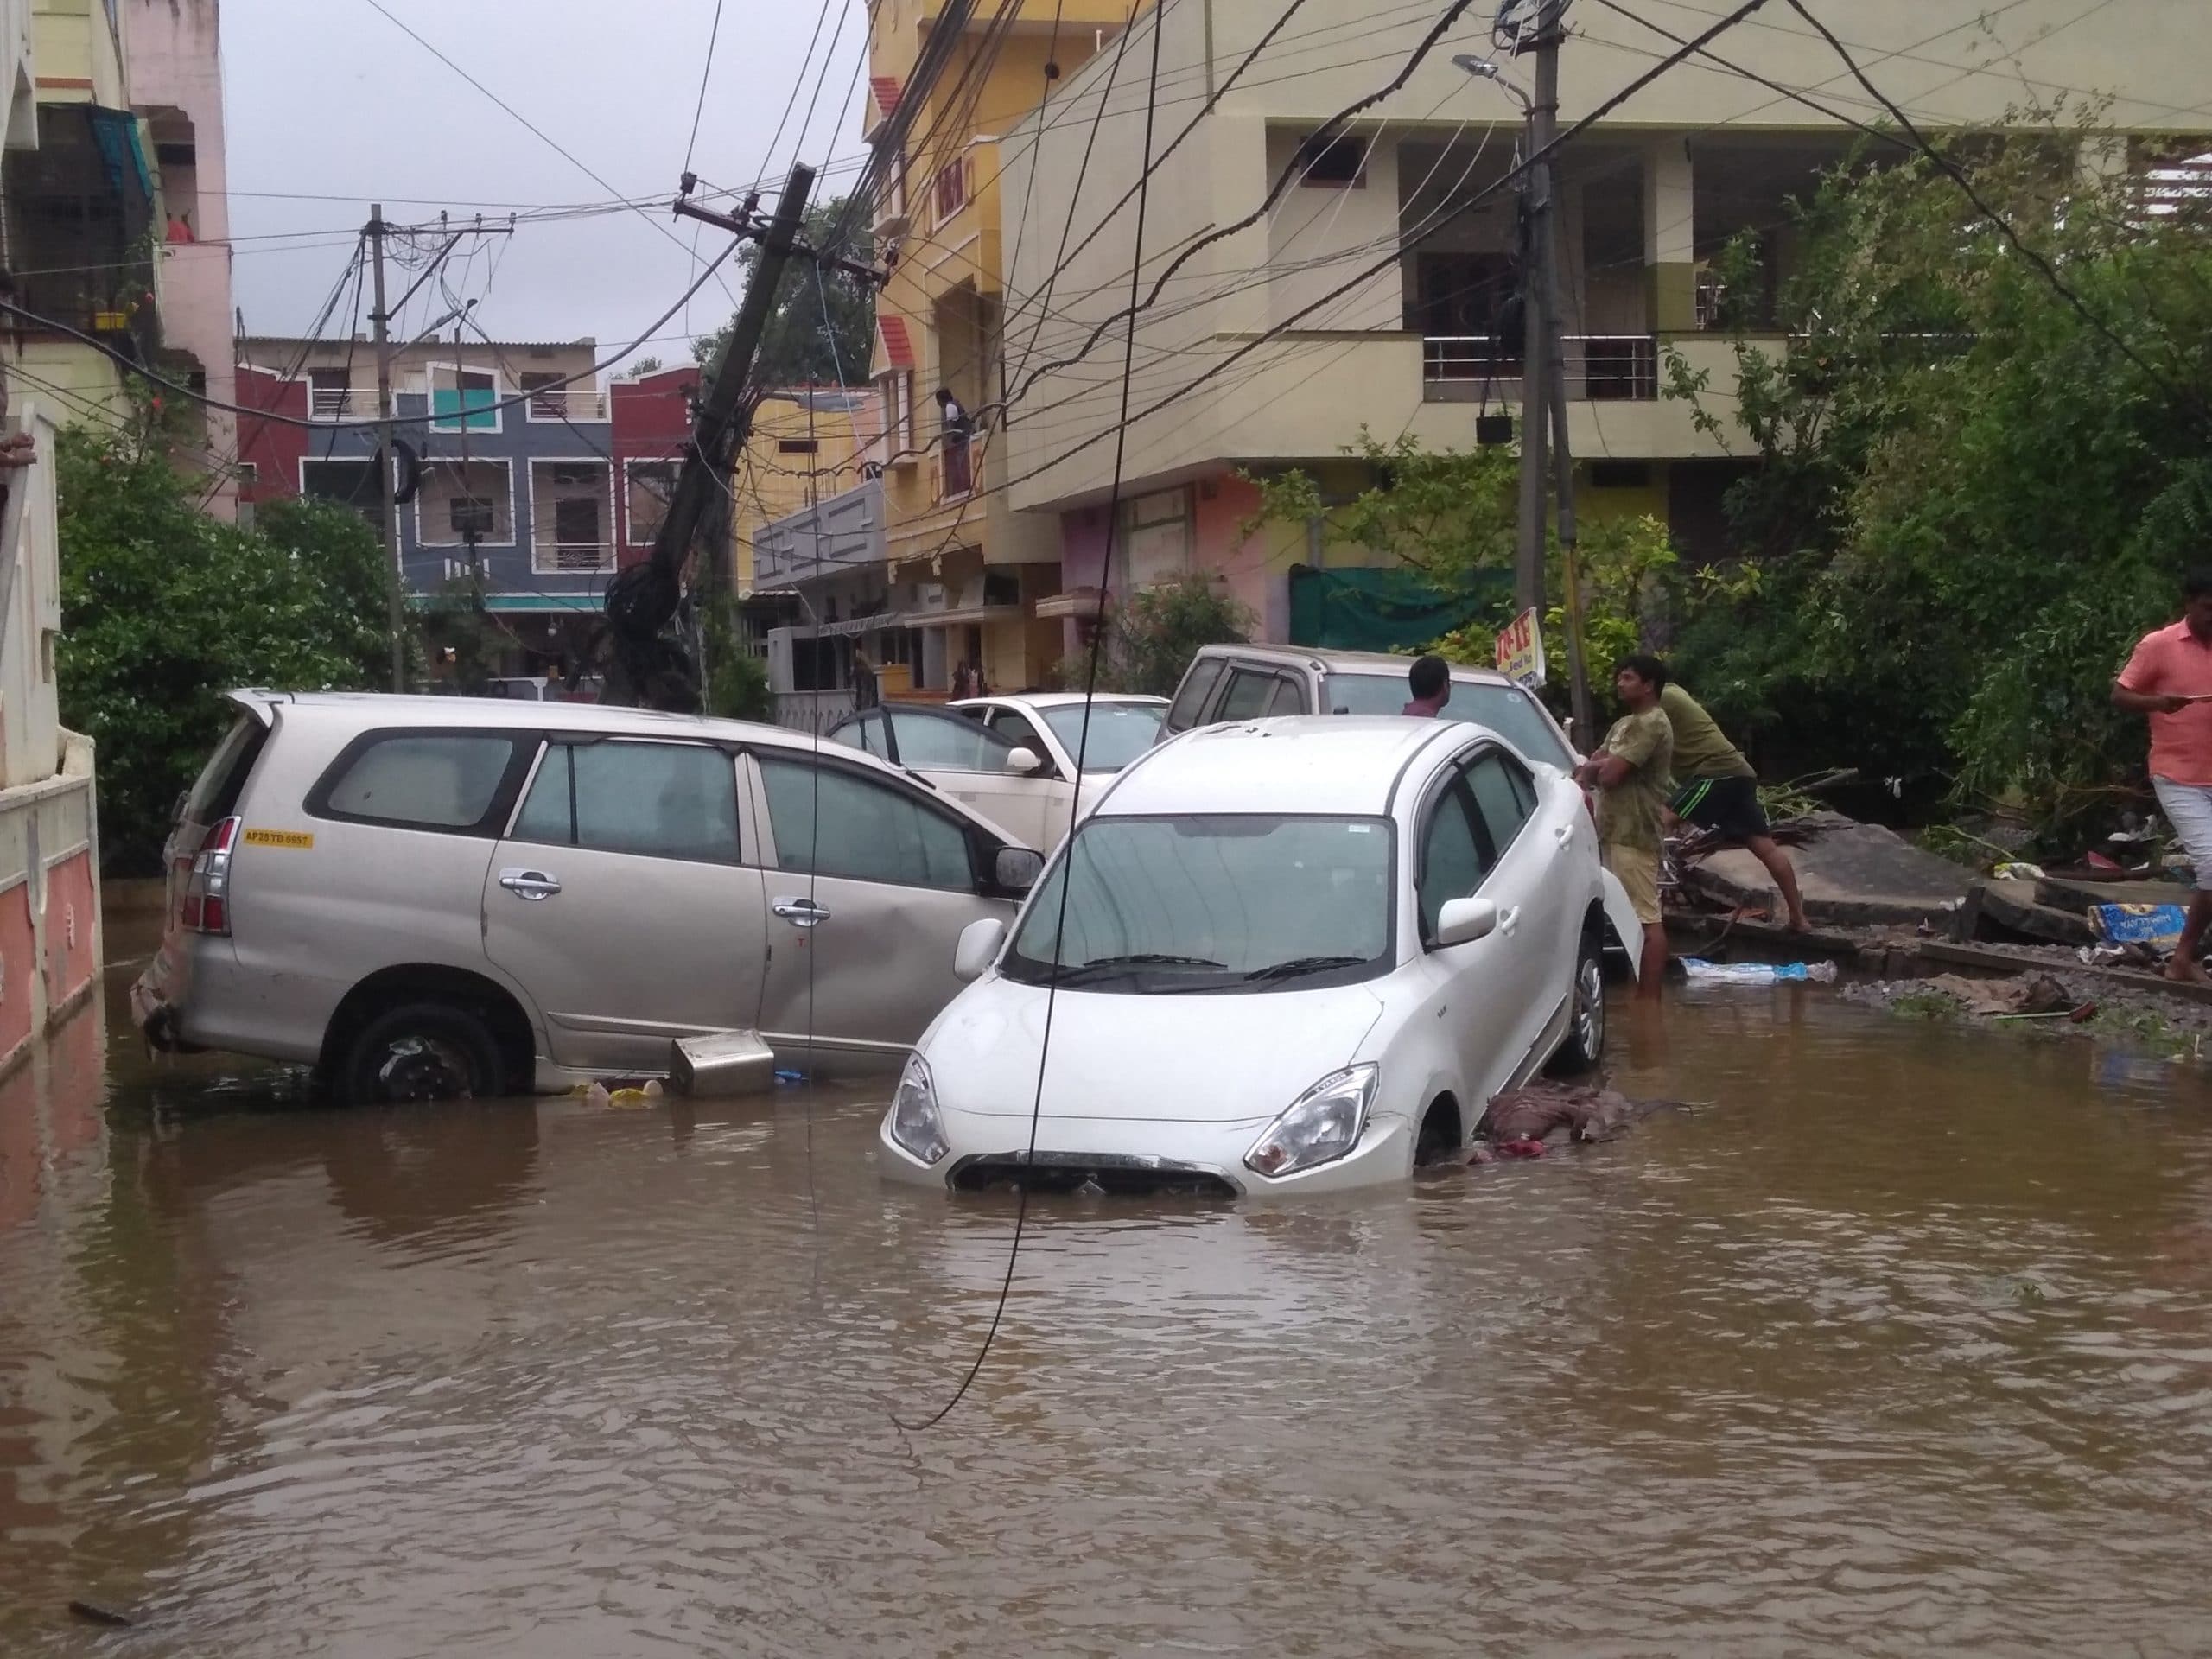
In times of climate change, software developers across the world have worked together to create an open source online tool to predict floods and understand their impact much better.
The World Flood Mapping Tool aims to “help plan urban and agricultural development, effective flood defences, disaster readiness, and identify supply chain vulnerabilities,” the team that worked on it has said.
“Flooding disasters are a recurring event. Every year, the intensity and frequency of floods is going up. When there’s a flood, there’s a rush of activity. We try to manage that particular event, and then we forget about it. We wait for the next one,” said UNU-INWEH GIS and remote sensing specialist Dr Hamid Mehmood in an exclusive online interview.
But researchers wanting to learn from previous floods can’t map out historical floods. They lack access to the data. Existing inundation and flood risk maps in most Third World countries are out-of-date and do not consider rapid urban development or the impact of climate change.
A majority of forecasting centres in flood-prone countries lack the ability to improve the spatial coverage of flood early warning systems (FEWS), and generate historical inundation and flood risk maps. Developing these maps nationally with conventional techniques is costly.
That’s where the Flood Mapping Tool (FMT) makes a difference. It promises to produce accurate historical inundation maps. It “bypasses the high-cost issue by using big Earth data, AI models, open data, and cloud computing.” It is expected to provide critical input to flood mitigation and emergency response, land use planning and investment in resilient infrastructure, insurance schemes, and overall public awareness of flood risks.
Data from 1985
This online tool maps floods from 1985 onwards, right up to the street level. It has been created by the UN University’s Institute for Water, Environment and Health (UNU-INWEH) with the support of Google and MapBox, among others. Based in Hamilton, Ontario, this research and training institute of the United Nations University is a “think tank on water” and has been set up to address water scarcity and access issues internationally. The United Nations University, or UNU, is itself the Tokyo based academic and research arm of the UN.
“The idea is pretty simple. We take the Landsat satellite archive data, stack the satellite imagery on top of each other, and look from top to down at each pixel. We pick up the frequency of the presence or absence of water. From the pixels we can decide whether it’s a permanent or temporary water body. People have used this before, but for short periods of time. It has never been released as a tool that can be used globally,” said Dr Mehmood.
Flood maps help communities to know which areas have the highest risk of flooding. “What we want to do is to take risk-mapping down at the street level. We can’t say the whole district is high risk; that doesn’t make sense,” he added.
To be open sourced soon
This tool will soon be open sourced. “We will be publishing the tool on INWEH’s GitHub account under the Academic Free License v3.0. The details for the algorithm are already published as an open-access publication,” said Dr Mehmood.
Dr Mehmood, who traces his roots to South Asia and led the tool’s development, also stated that a UNU-INWEH survey showed a majority of flood forecasting centres in flood-prone countries “lack the ability to run complex flood forecasting models.”
Using Landsat and the Google Earth Engine Cloud
The tool offers the mapping of flood areas, using Landsat with the Google Earth Engine Cloud platform. It has deployed Landsat data since 1985. Landsat is the longest-running enterprise for collecting satellite imagery of Earth, run by NASA and the US Geological Survey.
Layers of Landsat information for a selected region and specified timeframe identify temporary and permanent water bodies while integrating site-specific elevation and land-use data. This produces a detailed map of flood inundation in recent decades, with available overlays of population, buildings and land use, which can be used for community planning, as well as building zoning and insurance assessments. To validate the technology, maps generated in less than a minute using the new tool were compared to documented flooding events in Australia, Bangladesh, Canada, Cambodia, India, Mozambique, Sri Lanka and Thailand, with 82 per cent accuracy achieved, the UNU said.
Partners for this project include tech giant Google (offering in-kind support through the Google Cloud for Researchers programme); MapBox, the San Francisco-based provider of custom online maps for websites and applications; and India’s International Institute of Information Technology, known for its narrow and deep focus on computer science.
This tool is promoted as being “simple to use.” All one needs is Internet access to visit floodmapping.inweh.unu.edu and obtain a flood map at 30-metre resolution — street by street level.
Future plans
More solutions are planned after the Flood Mapping Tool, or FMT. A Web based Spatial Decision Support System (WSDSS) aims to address information gaps in flood early warning and risk management systems. The WSDSS will include FMT and a flood risk prediction tool (FRPT).
The FRPT is due to be released by 2022, using AI models to generate current and future flood risk maps for three climate change scenarios — at the city, district, and river basin levels. The AI models will be trained using the inundation maps generated by the FMT and open data sets, including land use, land cover, precipitation, temperature, gender, and age-disaggregated socio-economic data.
The WSDSS will improve the spatial and temporal coverage of early warning and risk management. It hopes to build the capacity of flood forecasting centres in the ‘Global South’ to use AI models, Big Data and cloud computing to analyse the impacts of climate change.
The Flood Mapping Tool has been developed over two years. Technical and national disaster management experts were engaged from Afghanistan, Bangladesh, Bhutan, India, Pakistan, Nepal, and Sri Lanka to design, review and test the tool.
| USEFUL LINKS |
| Flood mapping tool (FMT): https://floodmapping.inweh.unu.edu Mapping of flood areas using Landsat with Google Earth Engine Cloud platform: https://www.mdpi.com/2073-4433/12/7/866 Presentation on the new tool: https://bit.ly/2XZi8ld Hamid Mehmood, GIS and remote sensing specialist, interview: https://youtu.be/ijvZZiVDLyA |
In the next release of the tool, the team plans to increase the resolution of the open-access version by using data from multiple satellite sensors (harmonised Landsat Sentinel-2 data). A paid version of the tool with sub-metre accuracy is also in development, which caters to the need of the commercial sector (insurance, real estate, agriculture).
Role for GIS and remote sensing
To mitigate the impact of flooding, experts who created this solution are pushing governments to do three things: (1) Improve the accuracy of flood maps to capture the true extent of historical floods, rivers, streams, and water bodies; (2) Improve risk mapping and introduce policies to reduce risk; and (3) Invest in the infrastructure to reduce risks at the community level.
“In the last 5-10 years, GIS and remote sensing has turned into a cross-cutting technology. GIS-remote sensing has evolved a lot. It integrates data from UABS (unmanned aerial base stations), sensors, and IoT (Internet of Things), and starts using the cloud computing platform. I think it will make a lot of contribution in meeting these global challenges,” said Dr Mehmood, indicating his optimism about the field he works in.
| Facts and figures |
|
 “This is a really interesting tool, to understand where floods have happened and how they have affected populations. What will make it more interesting and useful is the temporal aspects and land use imagery. “If it can be mapped over Google Maps, which is open source, it will help lay people who can read maps understand where floods have happened and where they are likely to happen in the future. “Rainfall data could make it even more useful to match floods to the quantity of rain over a particular period. For example, if there has been heavy rain on Day 1 in the catchment area, there is a flood on Day X in the downstream area. That could help understand and plan for evacuations or countermeasures. It will also help to understand where catchment area treatments will have the most impact in mitigating floods. “Many Indian water experts have been mapping aquifers, watersheds and river basins. But there is nothing like this in India. Given our vulnerability to floods, this tool could be really useful here.” —Nitya Jacob, water policy analyst and author of ‘Jalyatra, Exploring India’s Traditional Water Management Systems’ |


