

Data analysis has become imperative for companies, and there is a huge demand for data-driven applications with user friendly interfaces. This article tells you how to develop an interactive web app using the Shiny package in R, which is a popular programming language for data science.
Nearly every business across the world relies on data today, in some way or the other. In fact, data science has helped transform many businesses by using data-driven applications, whether in the field of finance, banking, retail, logistics, e-commerce, transportation, airlines, or any other.
High performance computers and low-cost storage allow us to predict results in minutes today rather than the many hours it used to take earlier. Data scientists focused on the future are developing easy to use applications with high performance and multi-dimensional visualisation. It all starts with Big Data, which consists of three components: quantity, diversity, and velocity. Algorithms and models are fed from this data. The most cutting-edge data scientists working in machine learning and AI are creating models that self-improve, detecting and learning from their errors.
Statistics and computing are used to turn data into useful information in the field of data science, often termed as data-driven science. Data science is a synthesis of methods from a variety of fields to gather, analyse, and interpret data in order to develop new insights and make choices. The technological disciplines that constitute data science include statistics, probability, mathematics, machine learning, business intelligence, and some programming.
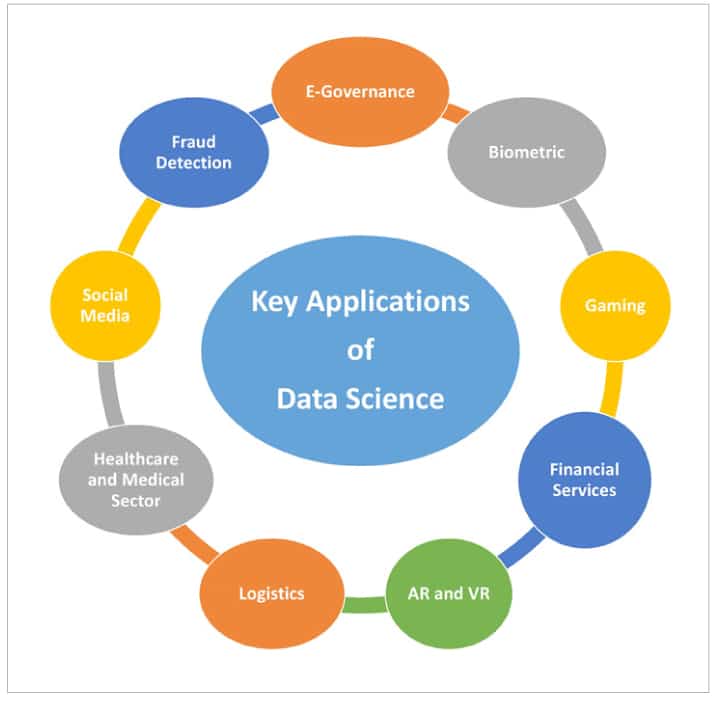
Data science can be applied in various areas (Figure 1). The analysis of large, complicated data sets is the focus of data science. It has helped to create a new universe in which data is seen in whole new ways. Tech giants like Amazon, Google, and Facebook use data science principles for business intelligence and decision making.
R: The language for data science
Data analysis and insights are urgently needed because of the volume of information available. Raw data is transformed into finished data products with the help of a number of technologies. When it comes to research, processing, transformation, and visualisation of data, there are few better tools than R.
The key features in R for data science are:
- Data pre-processing
- Social media fetching and analysis
- Assorted operations on data frames
- Extract, transform, load (ETL)
- Connection to a variety of databases, including SQL and spreadsheets
- Interaction with NoSQL databases
- Training and prediction with models
- Machine learning models
- Clustering
- Fourier transform
- Web scraping
R is a robust programming language commonly used in statistical computation and data analysis. Efforts to enhance R’s user interface have been going on since long. Several data science groups throughout the world have followed the development of R from a simple text editor to the more current interactive R Studio and Jupyter Notebooks.
Only the contributions of R users throughout the world have made this possible. The inclusion of strong packages in R has made it increasingly powerful over time. Numerous open source packages have made it easier and more efficient to work with large data sets and visualise data.
Developing interactive web applications in R using Shiny
You can construct interactive web apps in R using the Shiny package. Apps can be hosted on a website, embedded in R Markdown documents, or used to develop dashboards and visualisations. CSS themes, HTML widgets, and JavaScript actions can all be used to customise your Shiny apps further.
Shiny is an R tool that makes it simple to create interactive web apps. It allows you to extend your R code to the web so that it may benefit from the larger community of people who can use it.
In addition to Shiny’s built-in features, there are a number of third-party extension packages available, such as shinythemes, shinydashboard, and shinyjs.
There are various apps that can be developed using Shiny. Here is a list of a few of them.
- Machine learning based web apps
- Web apps with dynamic controls
- Data-driven dashboards
- Interactive apps for multiple data sets
- Real-time data visualisation panels
- Data collection forms
- Shiny web apps can be divided into the following:
- User interface
- Server function
- Shiny app function
For better understanding, you can refer to the examples and use cases available at https://shiny.rstudio.com/gallery/.
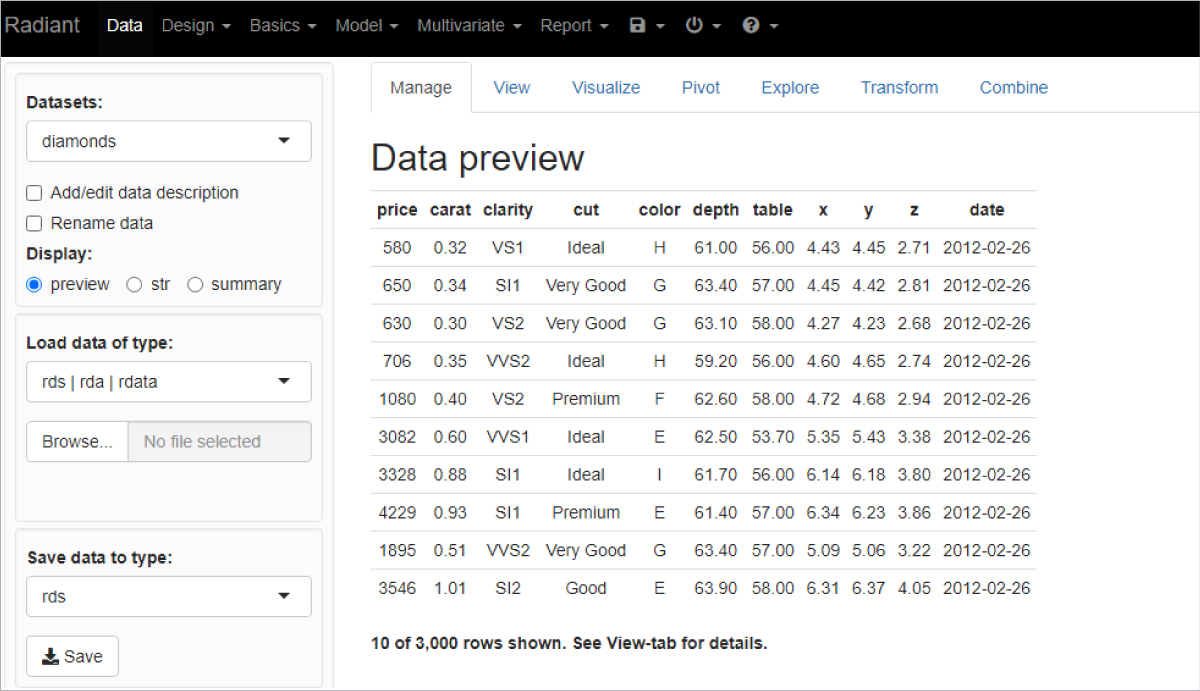
One of the apps developed using Shiny is shown in Figure 2 (https://shiny.rstudio.com/gallery/radiant.html).
Generation of a sales dashboard
The code snippet for a web app related to a sales dashboard is given below. This dashboard has multiple controls and user interface modules to view the data.
First, the Shiny package is installed and then it is called in the code so that the output can be presented in the form of a web page.
library(shiny)
library(dplyr)

sales <- vroom::vroom(“salesdata.csv”, na = “”)
ui <- fluidPage(
titlePanel(“Dashboard for Sales Data”),
sidebarLayout(
sidebarPanel(
selectInput(“territories”, “territories”, choices = unique(sales$territories)),
selectInput(“Customers”, “Customer”, choices = NULL),
selectInput(“orders”, “Order number”, choices = NULL, size = 5, selectize = FALSE),
),
mainPanel(
uiOutput(“customer”),
tableOutput(“data”)
)
)
)
server <- function(input, output, session) {
territories <- reactive({
req(input$territories)
filter(sales, territories == input$territories)
})
customer <- reactive({
req(input$Customers)
filter(territories(), Customers == input$Customers)
})

output$customer <- renderUI({
row <- customer()[1, ]
tags$div(
class = “well”,
tags$p(tags$strong(“Name: “), row$customers),
tags$p(tags$strong(“Phone: “), row$contact),
tags$p(tags$strong(“Contact: “), row$fname, “ “, row$lname)
)
})

order <- reactive({
req(input$order)
customer() %>%
filter(ORDER == input$order) %>%
arrange(OLNUMBER) %>%
select(pline, qty, price, sales, status)
})

output$data <- renderTable(order())

observeEvent(territories(), {
updateSelectInput(session, “Customers”, choices = unique(territories()$Customers), selected = character())
})
observeEvent(customer(), {
updateSelectInput(session, “order”, choices = unique(customer()$order))
})

}
shinyApp(ui, server)
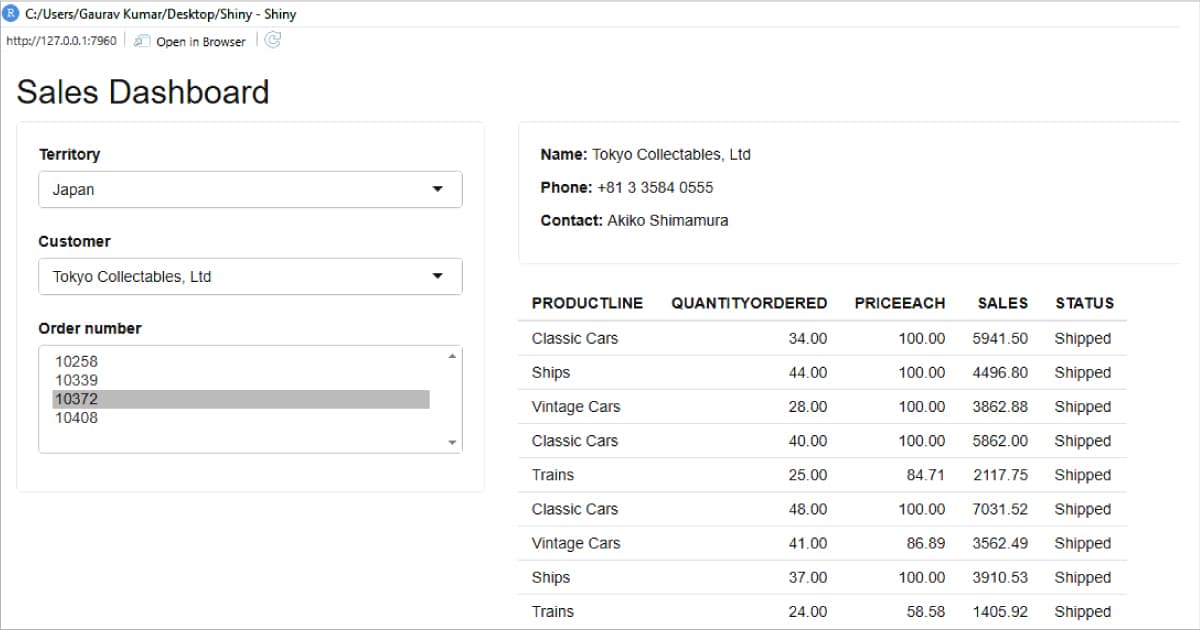
On running the code of the Shiny app, the output shown in Figure 3 is generated which can be viewed on any web browser. The sales dashboard has multiple controls and is quite interactive with different user interface modules.
With the use of Shiny cloud, this app can be deployed and hosted on the cloud for anytime anywhere availability on the internet.
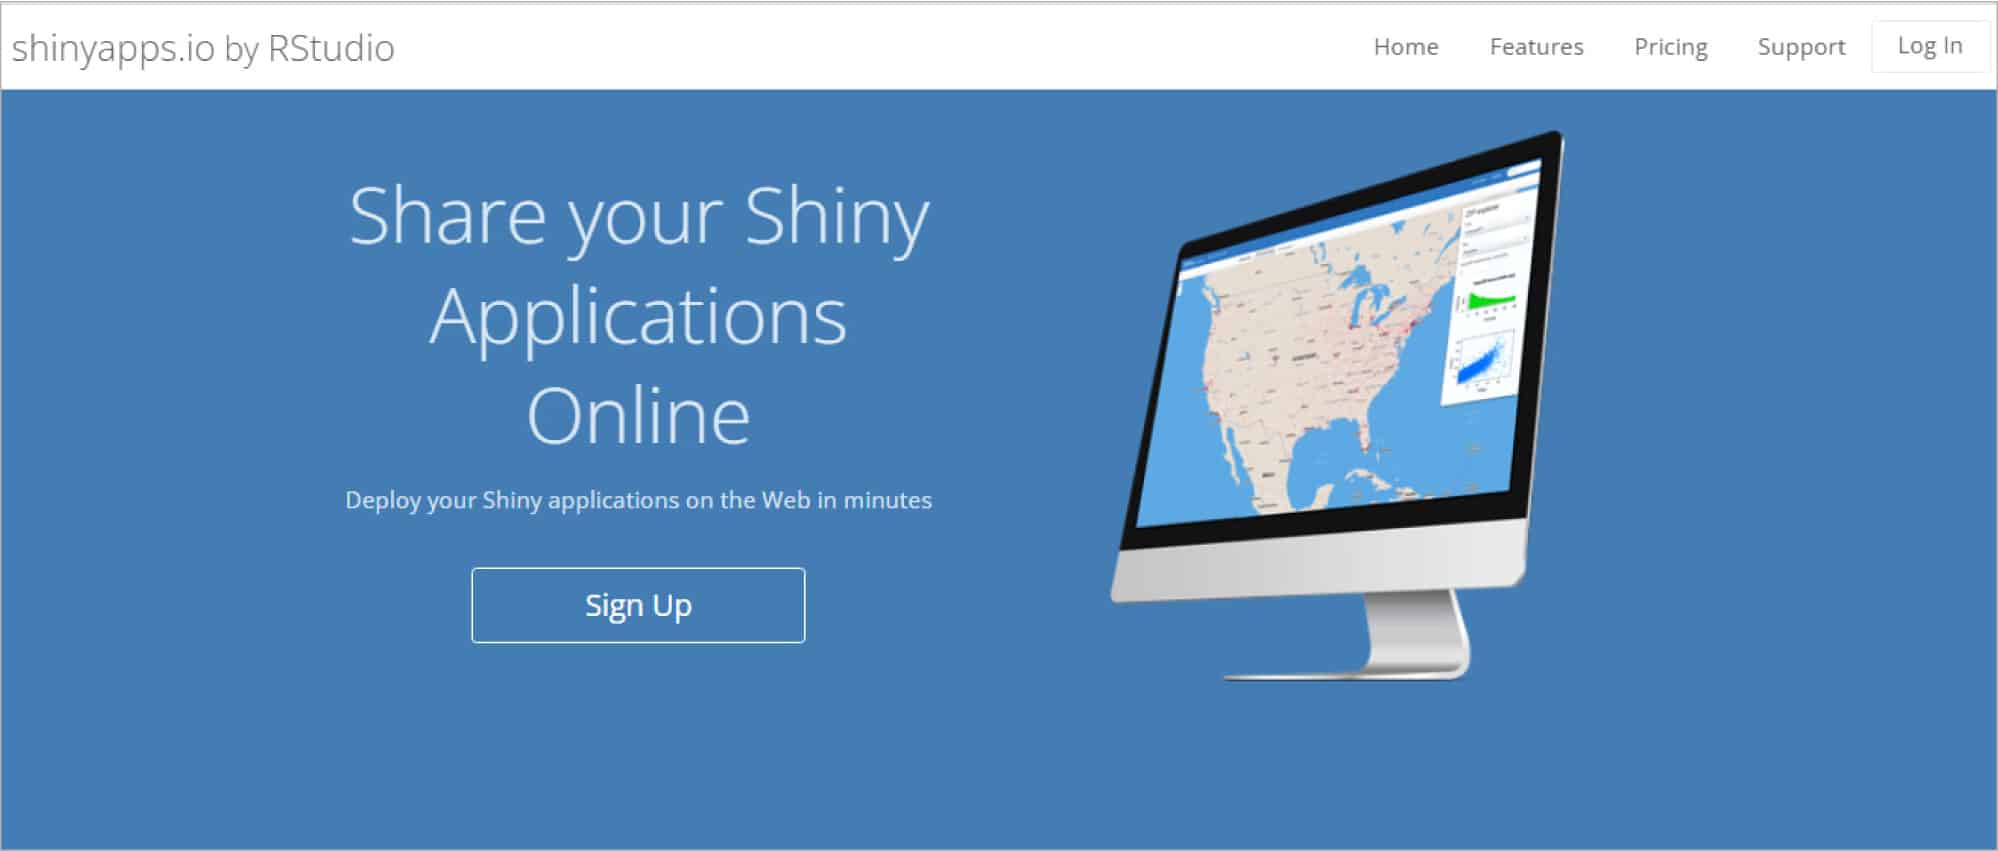
The free variant of Shiny cloud allows five applications to be deployed within 25 active hours.
Researchers and data scientists can develop user-friendly apps driven with real-time data using the Shiny library of R. This library can also be used for deploying their machine learning apps on web platforms.


