
















































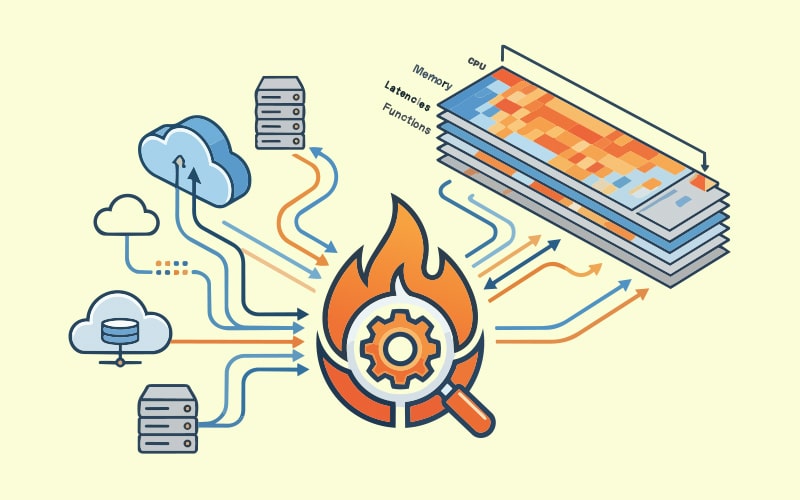

With its advanced architecture, Grafana Pyroscope enables organisations to identify CPU hotspots, memory leaks, inefficient code paths, lock contention issues, and performance regressions with remarkable precision.
Grafana Pyroscope is an open source continuous profiling platform designed to help developers, system administrators, DevOps engineers, and site reliability engineers (SREs) identify performance bottlenecks in applications and infrastructure. It allows users to see how CPU, memory, and other resources are being used over time by continuously gathering profile data from active applications and storing it for long-term analysis. Conventional profiling tools are sometimes limited for use in development or troubleshooting sessions. Pyroscope, on the other hand, continuously profiles applications in production environments with very little overhead, enabling businesses to identify regressions in performance, maximise resource use, and enhance application dependability. The technology, which was first created by Pyroscope and then purchased by Grafana Labs, is now an essential part of contemporary observability platforms.
What is continuous profiling?
Continuous profiling is the process of continuously collecting performance data from applications while they are running. It enables teams to:
- Detect CPU bottlenecks
- Identify memory leaks
- Analyse code execution paths
- Track performance regressions
- Reduce cloud infrastructure costs
- Improve application responsiveness
Table 1 describes the difference between traditional and continuous profiling.
| Continuous profiling | Traditional profiling |
| Runs continuously | Performed manually |
| Long-term monitoring | Short-duration analysis |
| Production-focused | Development-focused |
| Historical trends available | Snapshot-based |
| Automated collection | High intervention |
Architecture of Grafana Pyroscope
Grafana Pyroscope follows a distributed continuous profiling architecture designed to collect, process, store, query, and visualise profiling data from applications running in production environments. The architecture of the tool consists of five main layers (Figure 1).
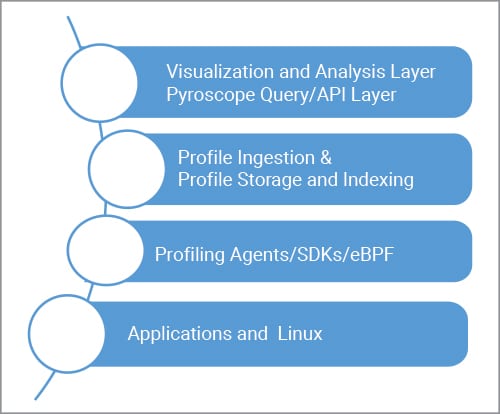
Applications and Linux infrastructure is the lowest layer of the architecture, where business applications like Java, Python, Go Services, Node.js, .NET, Kubernetes Pods, and Linux servers are executed. A typical workload in this layer includes web applications, microservices, databases, APIs, background jobs, and cloud services, all of which consume resources like CPU, memory, disk I/O, network I/O, threads, and locks. Pyroscope continuously observes these resources.
The second layer is the profiling agent layer, which collects execution data from running applications. This layer is responsible for various tasks such as:
- Sampling stack traces
- Monitoring memory allocations
- Tracking CPU usage
- Collecting profiling events
- Sending data to the Pyroscope server
It comprises three components: language-specific SDKs, eBPF profilers, and a sampling engine. Language-specific SDKs are provided for multiple languages. For example:
import pyroscope
pyroscope.configure(application_name=”ecommerce-app”,
server_address=http://pyroscope-server:4040
)
Modern Pyroscope deployments can utilise Linux eBPF technology. And instead of tracing every function call, Pyroscope uses statistical sampling.
The profile storage and indexing layer is the core component of Grafana Pyroscope responsible for storing, organising, compressing, indexing, and retrieving profiling data collected from applications. Without an optimised storage and indexing mechanism, continuous profiling data would quickly consume excessive storage space and become difficult to analyse.
The profile ingestion and processing layer is the main part of Grafana Pyroscope and connects the profiling agents to the storage layer. Its main job is to get profile information from apps, check if it’s correct, work with the data, group similar profiles together, make the data smaller, add extra details to it, and get it ready to be stored and used quickly. In a big production setting, thousands of applications can keep sending profiling data every second. This layer makes sure this data is managed smoothly without overloading the storage system.
The Pyroscope query/API layer is the component that sits between the storage layer and the visualisation layer. Retrieving, processing, aggregating, and delivering profiling data required by users, Grafana dashboards, APIs, and other observability tools is its main duty. The Query/API layer is in charge of effectively receiving the profiling data and providing insightful performance information, while the ingestion layer is in charge of storing the data. Serving as the ‘brain’ of the retrieval system, it transforms user requests into optimal storage searches and provides data in formats appropriate for call graphs, differential profiles, flame graphs, and historical analysis.
The highest tier of the Grafana Pyroscope architecture is called the visualisation and analysis tier. It converts unprocessed profiling data into insightful visuals and useful information. The visualisation and analysis layer helps developers, system administrators, DevOps engineers, and SREs understand application behaviour, find performance bottlenecks, and optimise system performance, while the lower layers gather, process, store, and retrieve profile data. This layer is the main interface between users and profiling data. It offers timelines, differential views, flame graphs, call graphs, dashboards, and analytical tools that transform complicated profile data into understandable representations.
Advantages of Grafana Pyroscope
One of the most significant advantages of Pyroscope is continuous profiling. Other benefits are:
- Profiles applications 24×7.
- Captures historical performance data.
- Enables analysis of intermittent issues.
- Eliminates the need for manual profiling sessions.
- Minimal CPU overhead.
- Low memory consumption.
- Safe for production environments.
- Suitable for large-scale deployments and heterogenous environments.
- Is a unified profiling platform.
Pyroscope is fully open source. Organisations can deploy it on-premises or in private cloud environments without recurring software licensing expenses. It supports several programming languages including Go, Java, Python, Node.js, Ruby, and .NET.
Performance optimisation is now a crucial necessity for businesses of all sizes due to the growing complexity of contemporary Linux server setups. To find the underlying reasons for performance decline, traditional monitoring techniques that just look at infrastructure measures like CPU utilisation, memory consumption, disk I/O, and network throughput are no longer adequate. Deeper understanding of program behaviour and resource usage at the code level is necessary for modern performance tweaking. Continuous profiling has emerged as a powerful approach for addressing these challenges by providing continuous, low-overhead insights into how applications consume system resources. Among the available open source profiling solutions, Grafana Pyroscope stands out as a comprehensive and scalable platform for continuous performance analysis giving businesses a flexible, affordable, and vendor-independent way to monitor and optimise performance.