
















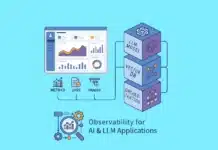




























The importance of observability in today’s AI-driven world cannot be underestimated, especially when it comes to addressing the challenges that Kubernetes can face.
The introduction of cloud computing around 2006 transformed infrastructure management. It enabled organisations to provision and manage resources on demand without the need to build their own physical infrastructure. Docker continued this evolution of infrastructure by introducing containers to enable application portability. Applications rely on specific libraries, files, and configurations that do not always work consistently across different operating systems. Containers solved this by packaging applications with their dependencies, allowing them to run reliably across different environments.
Unlike virtual machines, which require a complete operating system, containers run as lightweight processes, consuming fewer resources. This enables hundreds of containers to run on a single machine and allows applications to start within seconds instead of the longer boot times required by virtual machines. However, as container adoption grew, the next challenge was managing containers at scale.
This is where Kubernetes plays a role. It manages containers across different applications using deployments, StatefulSets, and other management tools. This makes it possible to efficiently deploy, coordinate, and manage large-scale containerized environments.
Why observability is needed in modern applications
As applications become more complex, challenges arise during production. When systems exhibit errors or unexpected failures, operations teams often don’t have a deep understanding of the application codebase. This makes troubleshooting slower and affects service reliability and customer experience. To close this gap between development and operations, organisations adopt DevOps, which combines development skills with operational knowledge.
With the rise of AI technologies such as ChatGPT and Gemini after 2021, modern systems have become even more distributed and complex, increasing the need for deeper visibility into application behaviour.
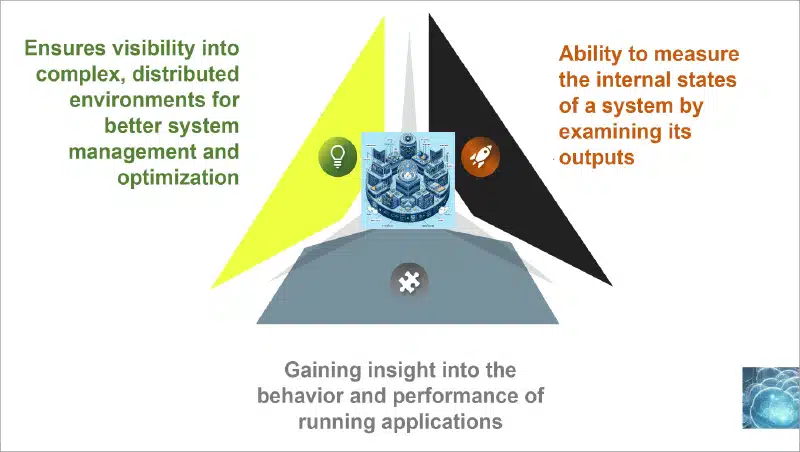
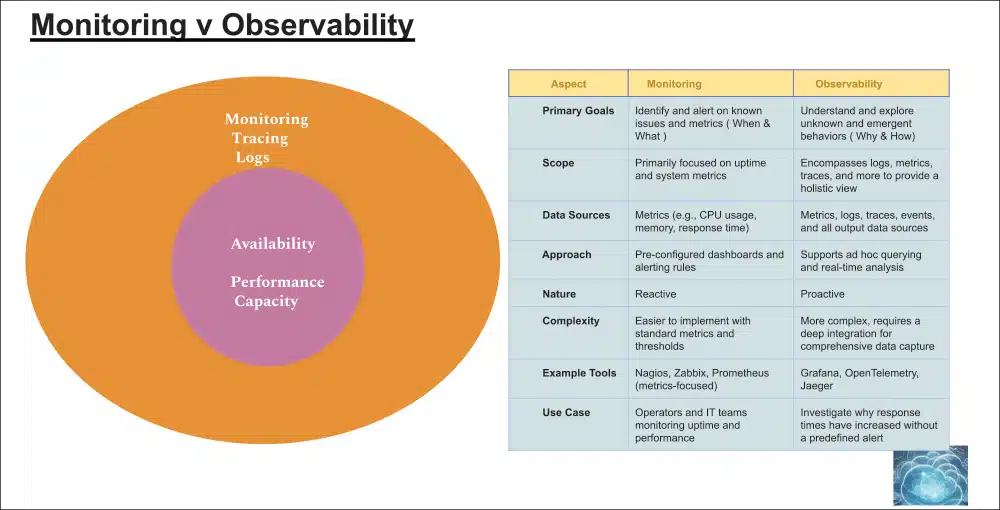
Observability addresses this challenge by helping organisations understand not only what happened, but also why it happened. It uses metrics, logs, traces and other data sources to diagnose system issues beyond basic monitoring.
This has become increasingly important as enterprises move from single-provider environments to multi-cloud architectures. A single application request may now pass through multiple platforms, such as Azure for authentication, AWS for computing and Google Cloud for data operations. Observability tools provide visibility across this entire flow, helping organisations identify performance issues, track system behaviour and improve reliability.
The three pillars of observability: Logs, metrics and traces
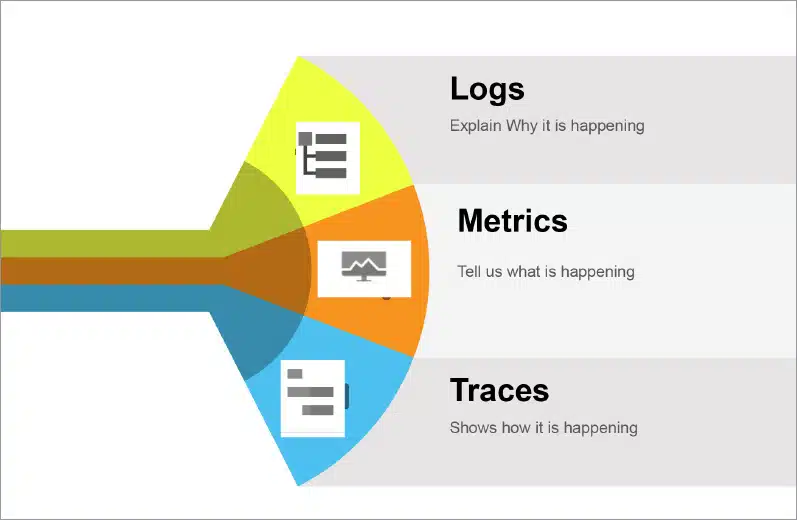
Logs capture information from system transactions and events in a running environment, including errors, warnings, notifications and other activities. Analysing logs helps identify why a system is not behaving as expected and determines the cause of failures.
Metrics are KPI-based measurement parameters used to create dashboards and visualise performance indicators such as CPU utilisation, disk utilisation, network throughput, incoming and outgoing traffic, etc.
Tracing records and tracks how a request moves end-to-end across different components of a system, providing visibility into the complete request flow.
Monitoring primarily focuses on system availability, performance and capacity, while observability extends beyond that by combining logs, traces and metrics to provide deeper insights into system behaviour. Monitoring is largely reactive, identifying issues after they occur, whereas observability enables a more proactive approach by helping organisations build reliable and resilient systems.
This shift has become increasingly important with the adoption of microservices architectures. In traditional monolithic architecture, all application modules are maintained within a single codebase. Even a small change in one module requires rebuilding and deploying the entire application, making updates slower and more complex. Microservices address this gap by decoupling application components into independent services that can be developed, managed and deployed separately. For example, an e-commerce platform such as Amazon involves multiple services, including product search, cart management, payment processing and email notifications. In a microservices environment, each of these functions operates independently, allowing a change in one service, such as the cart module, to be updated without impacting the others.
However, distributed microservices environments also introduce greater complexity, making observability essential. Organisations need to capture and analyse the three key components: logs, traces and metrics. Along with this, chaos engineering has emerged as an important practice to test system resilience.
Chaos engineering: Building resilient Kubernetes systems
Chaos engineering helps organisations understand how systems behave during unexpected failures by intentionally introducing controlled disruptions and analysing the response. Popularised by Netflix through its backend reliability experiments, the approach focuses on improving system resilience and maintaining consistent performance.
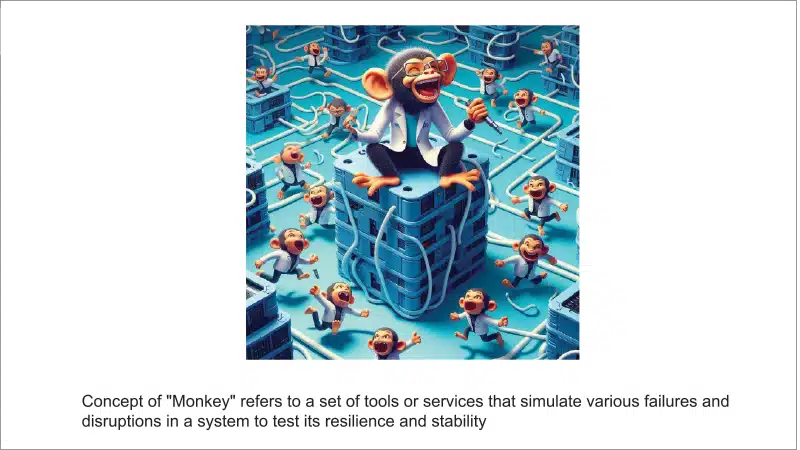
The process involves defining the system’s steady state and then introducing controlled failures, such as shutting down nodes, deleting pods, increasing traffic, adding latency or creating resource constraints. For example, if an application runs across 10 nodes, teams may intentionally take down two nodes to observe how the system responds. By comparing performance before and after the failure, organisations can identify weaknesses and improve reliability. Tools such as Netflix’s Monkey are used to simulate these failure scenarios.
Although chaos engineering requires additional resources, infrastructure and skilled teams, it has become increasingly important with the adoption of microservices and distributed architectures. Organisations use it to prepare for unpredictable traffic spikes and large-scale events such as Big Billion Days, Great Indian Festival sales or high-demand streaming events. Platforms such as Hotstar have benefited from similar reliability practices to deliver smoother experiences during major live events.
However, the engineering must be performed carefully, as failures are injected into running systems. Experiments need to be controlled and planned rather than randomly disrupting services. For example, shutting down most of the nodes in a cluster would not provide meaningful insights. Instead, teams continuously monitor system behaviour, collect data and use the findings to improve resilience.
As modern applications are distributed across cloud platforms, Kubernetes clusters, databases and interconnected services, failures can occur across multiple components. The goal of chaos engineering is not to allow business-impacting failures but to proactively understand failure scenarios and strengthen system reliability. It has also become an important practice in Site Reliability Engineering (SRE), where concepts such as SLOs (Service Level Objectives), SLIs (Service Level Indicators) and SLAs (Service Level Agreements) help measure, maintain and improve system reliability.
The challenges Kubernetes faces
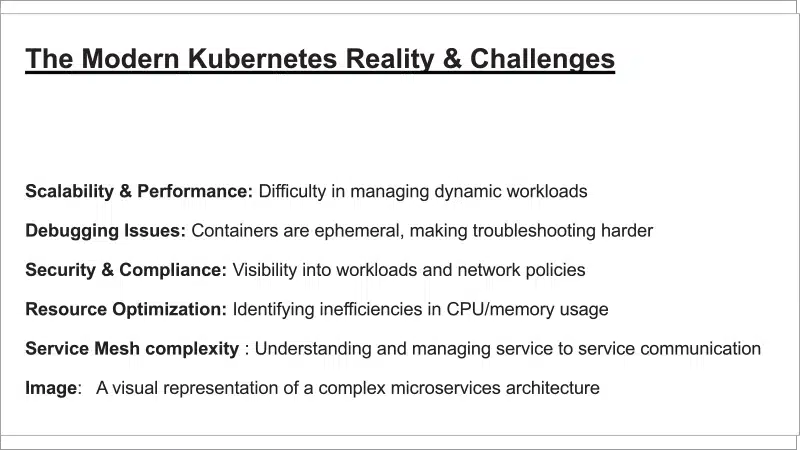
Kubernetes environments face several operational challenges, with scalability, performance and resource management being among the most critical. Since Kubernetes workloads are highly dynamic, organisations need effective autoscaling mechanisms such as Horizontal Pod Autoscaler (HPA) and Vertical Pod Autoscaler (VPA) to efficiently manage changing demands.
Debugging and root-cause analysis remain complex due to the distributed nature of Kubernetes. Identifying issues across running pods, containers and clusters requires deeper visibility into system behaviour beyond basic monitoring.
Security and compliance are also major concerns, requiring additional tools and configurations to identify vulnerabilities and strengthen protection. Solutions such as Trivy, Falco and Snyk help improve security monitoring, while configuration management requires separate focus beyond observability.
Other key challenges include cost optimisation, service mesh complexity and visualisation. Optimising CPU and memory allocation helps prevent resource overprovisioning and reduces costs. Service mesh solutions such as Istio provide visibility into service-to-service communication, while visualisation tools help teams understand system behaviour through graphical interfaces rather than relying only on command-line tools.
The golden signals of observability
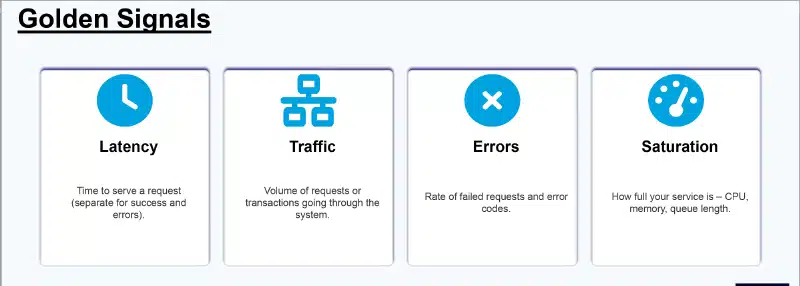
The golden signals of observability provide the foundation for monitoring modern applications and addressing Kubernetes challenges.
The first golden signal is latency, which measures the time taken to process requests and helps identify performance bottlenecks within the system. By analysing latency, organisations can understand delays in processing requests and optimise application and network performance.
The second signal is traffic, which provides visibility into the volume of requests entering the system and helps organisations understand workload patterns. For example, an e-commerce platform needs to differentiate between users who are browsing products and those performing critical activities such as placing orders or completing transactions, as each activity creates different demands on system resources.
The third signal is errors, which helps identify the type and frequency of failures occurring within the system. By analysing HTTP response codes such as 5xx, 4xx and 2xx, organisations can understand whether services are functioning as expected and identify recurring issues that require attention.
The fourth signal is saturation, which measures how efficiently the system handles incoming requests by analysing resource utilisation, including CPU, memory and other infrastructure requirements. This helps organisations optimise Kubernetes environments, maintain performance and ensure effective resource management.
Kubernetes environments are generally divided into three categories:
Self-managed Kubernetes: Organisations build and manage the entire Kubernetes environment, including the control plane and worker nodes, using virtual machines or cloud instances. This provides maximum control but requires greater operational responsibility.
Managed Kubernetes: The cloud provider manages the control plane, while organisations focus on managing worker nodes, node pools and applications. This reduces operational complexity while maintaining control over the application environment.
Autopilot Kubernetes: The cloud provider manages the complete Kubernetes infrastructure, including resource provisioning and cluster management, allowing organisations to focus only on deploying and running applications. For example, Google Kubernetes Engine (GKE) provides both Standard mode, where users manage the Kubernetes environment, and Autopilot mode, where Google Cloud handles infrastructure management.
Along with containerization, modern cloud-native environments rely on CI/CD, Infrastructure as Code (IaC) and observability platforms. IaC enables automated infrastructure provisioning, with tools such as Terraform widely used for this. The observability ecosystem, supported by communities such as CNCF, includes a wide range of tools for logging, tracing, metrics and cost engineering, including Fluentd, Fluent Bit, Dynatrace, Datadog, Splunk, CloudWatch and cloud monitoring platforms.
These tools collect signals generated by applications, users and services, helping organisations monitor, analyse and improve system performance. Platforms such as Google Cloud Operations Suite combine services like Cloud Monitoring, Cloud Trace, Cloud Logging, Error Reporting and Cloud Debugger to provide an integrated observability platform.
Building an observability data pipeline
Observability begins with collecting signals generated from multiple sources, including applications, APIs and microservices. These signals are processed through collectors and monitoring tools such as Prometheus, Grafana and operational agents. In Google Cloud, collected data can be stored and processed through services such as Cloud Storage, BigQuery and Pub/Sub. Cloud Storage provides low-cost storage, while BigQuery is used for advanced analysis of transactional and operational data. The choice of storage and processing platform depends on the organisation’s requirements, use cases and existing infrastructure.
Managing observability data also requires effective routing and governance. Google Cloud’s Cloud Logging service centralises logs, while Cloud Logs Router helps direct data to appropriate destinations, including Cloud Storage, BigQuery or third-party platforms such as AWS S3. The overall observability pipeline involves instrumenting applications, collecting telemetry data, processing it through appropriate tools and generating customised dashboards for analysis. With advancements in AIOps, backend processes are increasingly being enhanced with AI-driven automation, reducing manual intervention and improving system management.
Observability tools are evolving rapidly, with platforms such as Google Looker, Grafana, and others enabling advanced analytics and system visibility. Over the next few years, observability is expected to become increasingly integrated with AI, with OpenTelemetry configurations, APIs and SDKs moving towards an API-driven approach.
AI-driven observability enables systems to automatically analyse issues and take corrective actions, leading to agent-based environments where intelligent agents understand system behaviour, perform tasks and respond to failures. Alongside AI integration, organisations are also focusing on cost engineering, compliance, security, and governance while building observability solutions.
Observability must also integrate with SRE and DevOps workflows, including CI/CD pipelines, to improve deployment frequency and reduce deployment time. For Kubernetes adoption, organisations need to focus on reliability, scalability and automated telemetry pipelines that collect signals from multiple sources.
Major practices include defining SLOs (Service Level Objectives) to establish reliability targets and using SLIs (Service Level Indicators) to measure performance against those objectives. Technologies such as service mesh and eBPF, a kernel-based technology for performance tuning and deeper system visibility, are also becoming important.
Automation remains central to lowering the manual processes and strengthening DevOps-driven operations.