






















































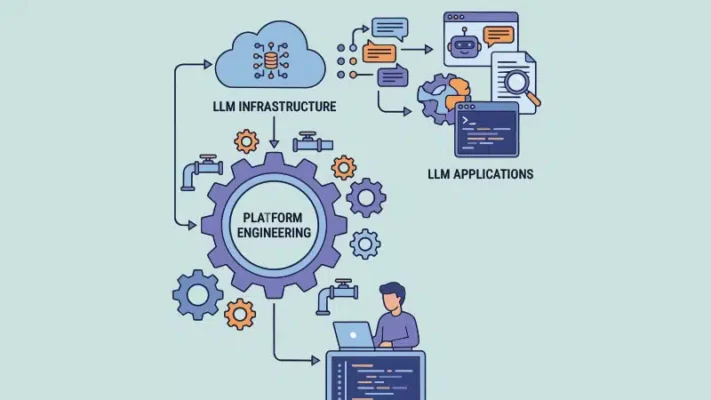

Glitches in an LLM service do not necessarily show up because of a poorly engineered platform. Even platforms built well can falter because LLM workloads violate reliable assumptions.
A platform team that has spent five years perfecting Kubernetes golden paths, Terraform modules, and GitOps pipelines can still get blindsided by its first production LLM service. The pipelines work. The clusters are healthy. And the p95 latency chart looks fine while users complain, the bill triples after a one-line prompt edit, and a security review asks a question nobody can answer: what can this agent do if someone hides an instruction inside a support ticket?
None of that happens because the platform was built badly. It happens because LLM workloads violate assumptions that were so reliable they stopped being visible. This article works through three of them:
- Observability for a system where latency has two phases and correctness is a distribution.
- Security for a system where input, retrieved data, and model output are all untrusted.
- Cost for a system that bills per token and behaves like the cost of goods sold.
The tools named are open source or open standards, and the patterns hold whether you self-host models or call a hosted API.
Why do LLM workloads break your platform assumptions?
Start with the request. In a conventional service, one request costs roughly what the last one costs, replicas are interchangeable, and adding capacity is a scaling decision.
An LLM request breaks all three. A 200 token prompt and a 120,000 token prompt travel the same code path and differ by orders of magnitude in compute. A replica already holding a conversation’s key value cache answers far faster than an identical replica that does not. And the instance you want during a spike may not exist, because accelerator capacity is contracted rather than elastic.
| Classic assumption | What holds for LLM workloads | Platform consequence |
| Requests cost about the same | Compute varies 100x by prompt and output length | Quotas must count tokens, not requests |
| Replicas are interchangeable | Each replica holds its own KV cache state | Load balancing must be cache aware |
| Latency is one number | Time to first token and inter-token delay differ | Two SLOs, measured separately |
| Correctness is binary | Output quality is a distribution | Testing becomes statistical evaluation |
| Input is data | Input is also instruction | The model is a confused deputy by design |
Read this table as a work plan. Every row implies a control the platform must provide, or each team will invent its own and none will agree.
What does an LLM platform actually look like?
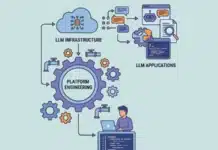
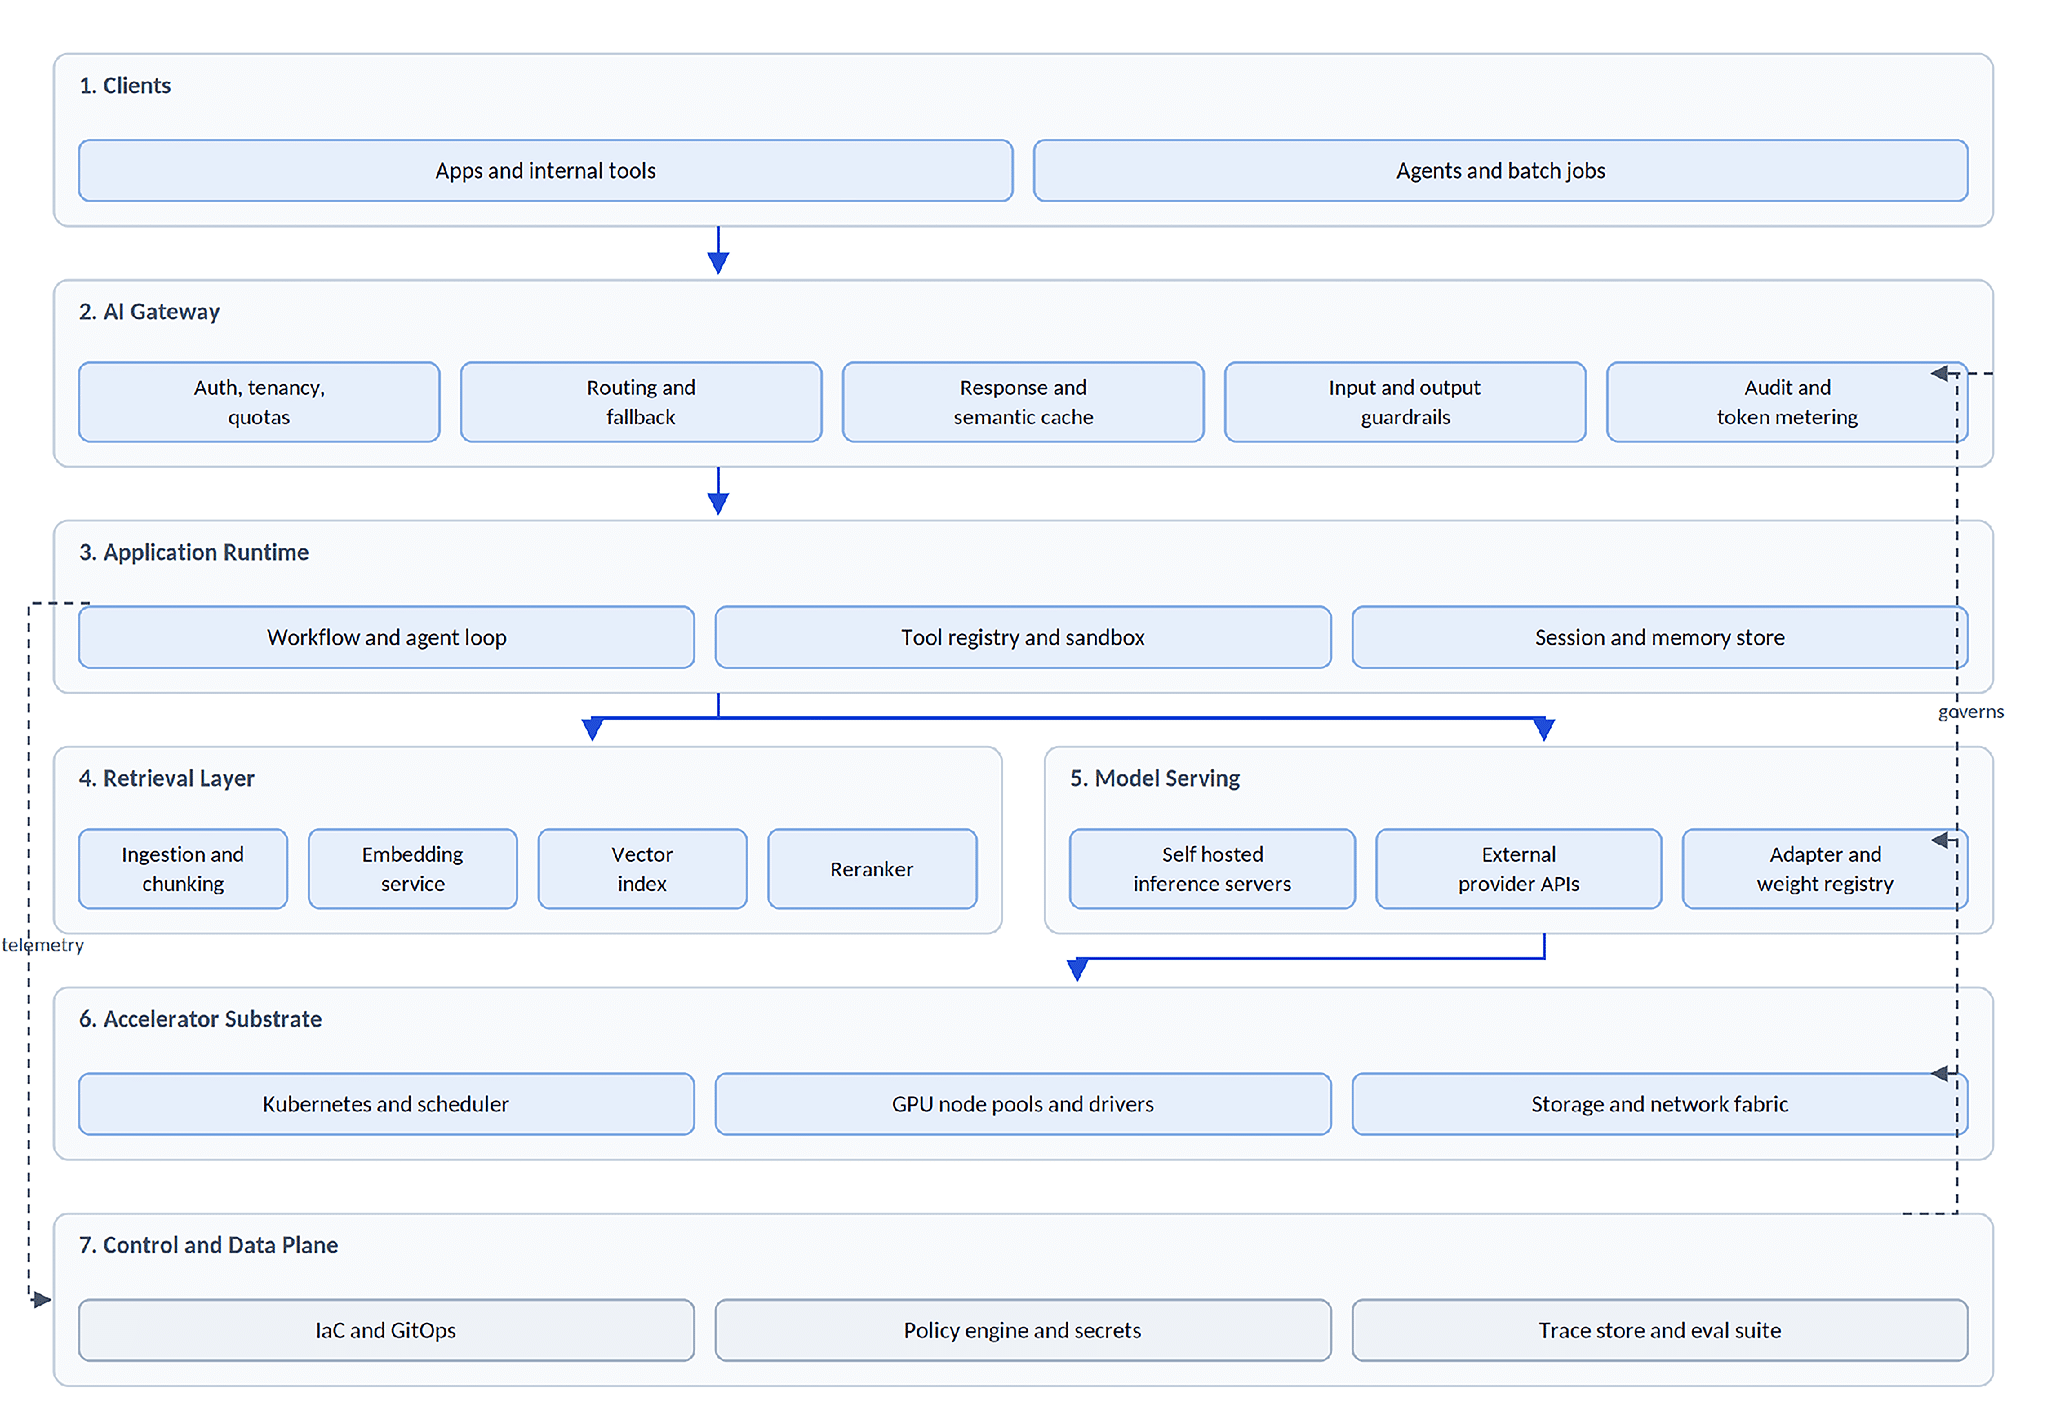
Most LLM platforms converge on the same seven layers, whether the team planned it or arrived there by accretion. Naming them helps, because it tells you where a given control belongs.
The gateway earns its place first, because only four controls can sit together there:
- Identity and tenancy, so every request carries an owner.
- Token metering, so cost is attributable before the invoice arrives.
- Guardrails on input and output, applied once instead of per service.
- Routing and fallback, so you can switch providers without touching application code.
Teams that skip it end up with no cost attribution, no kill switch, and no failover.
What happens inside a single request?
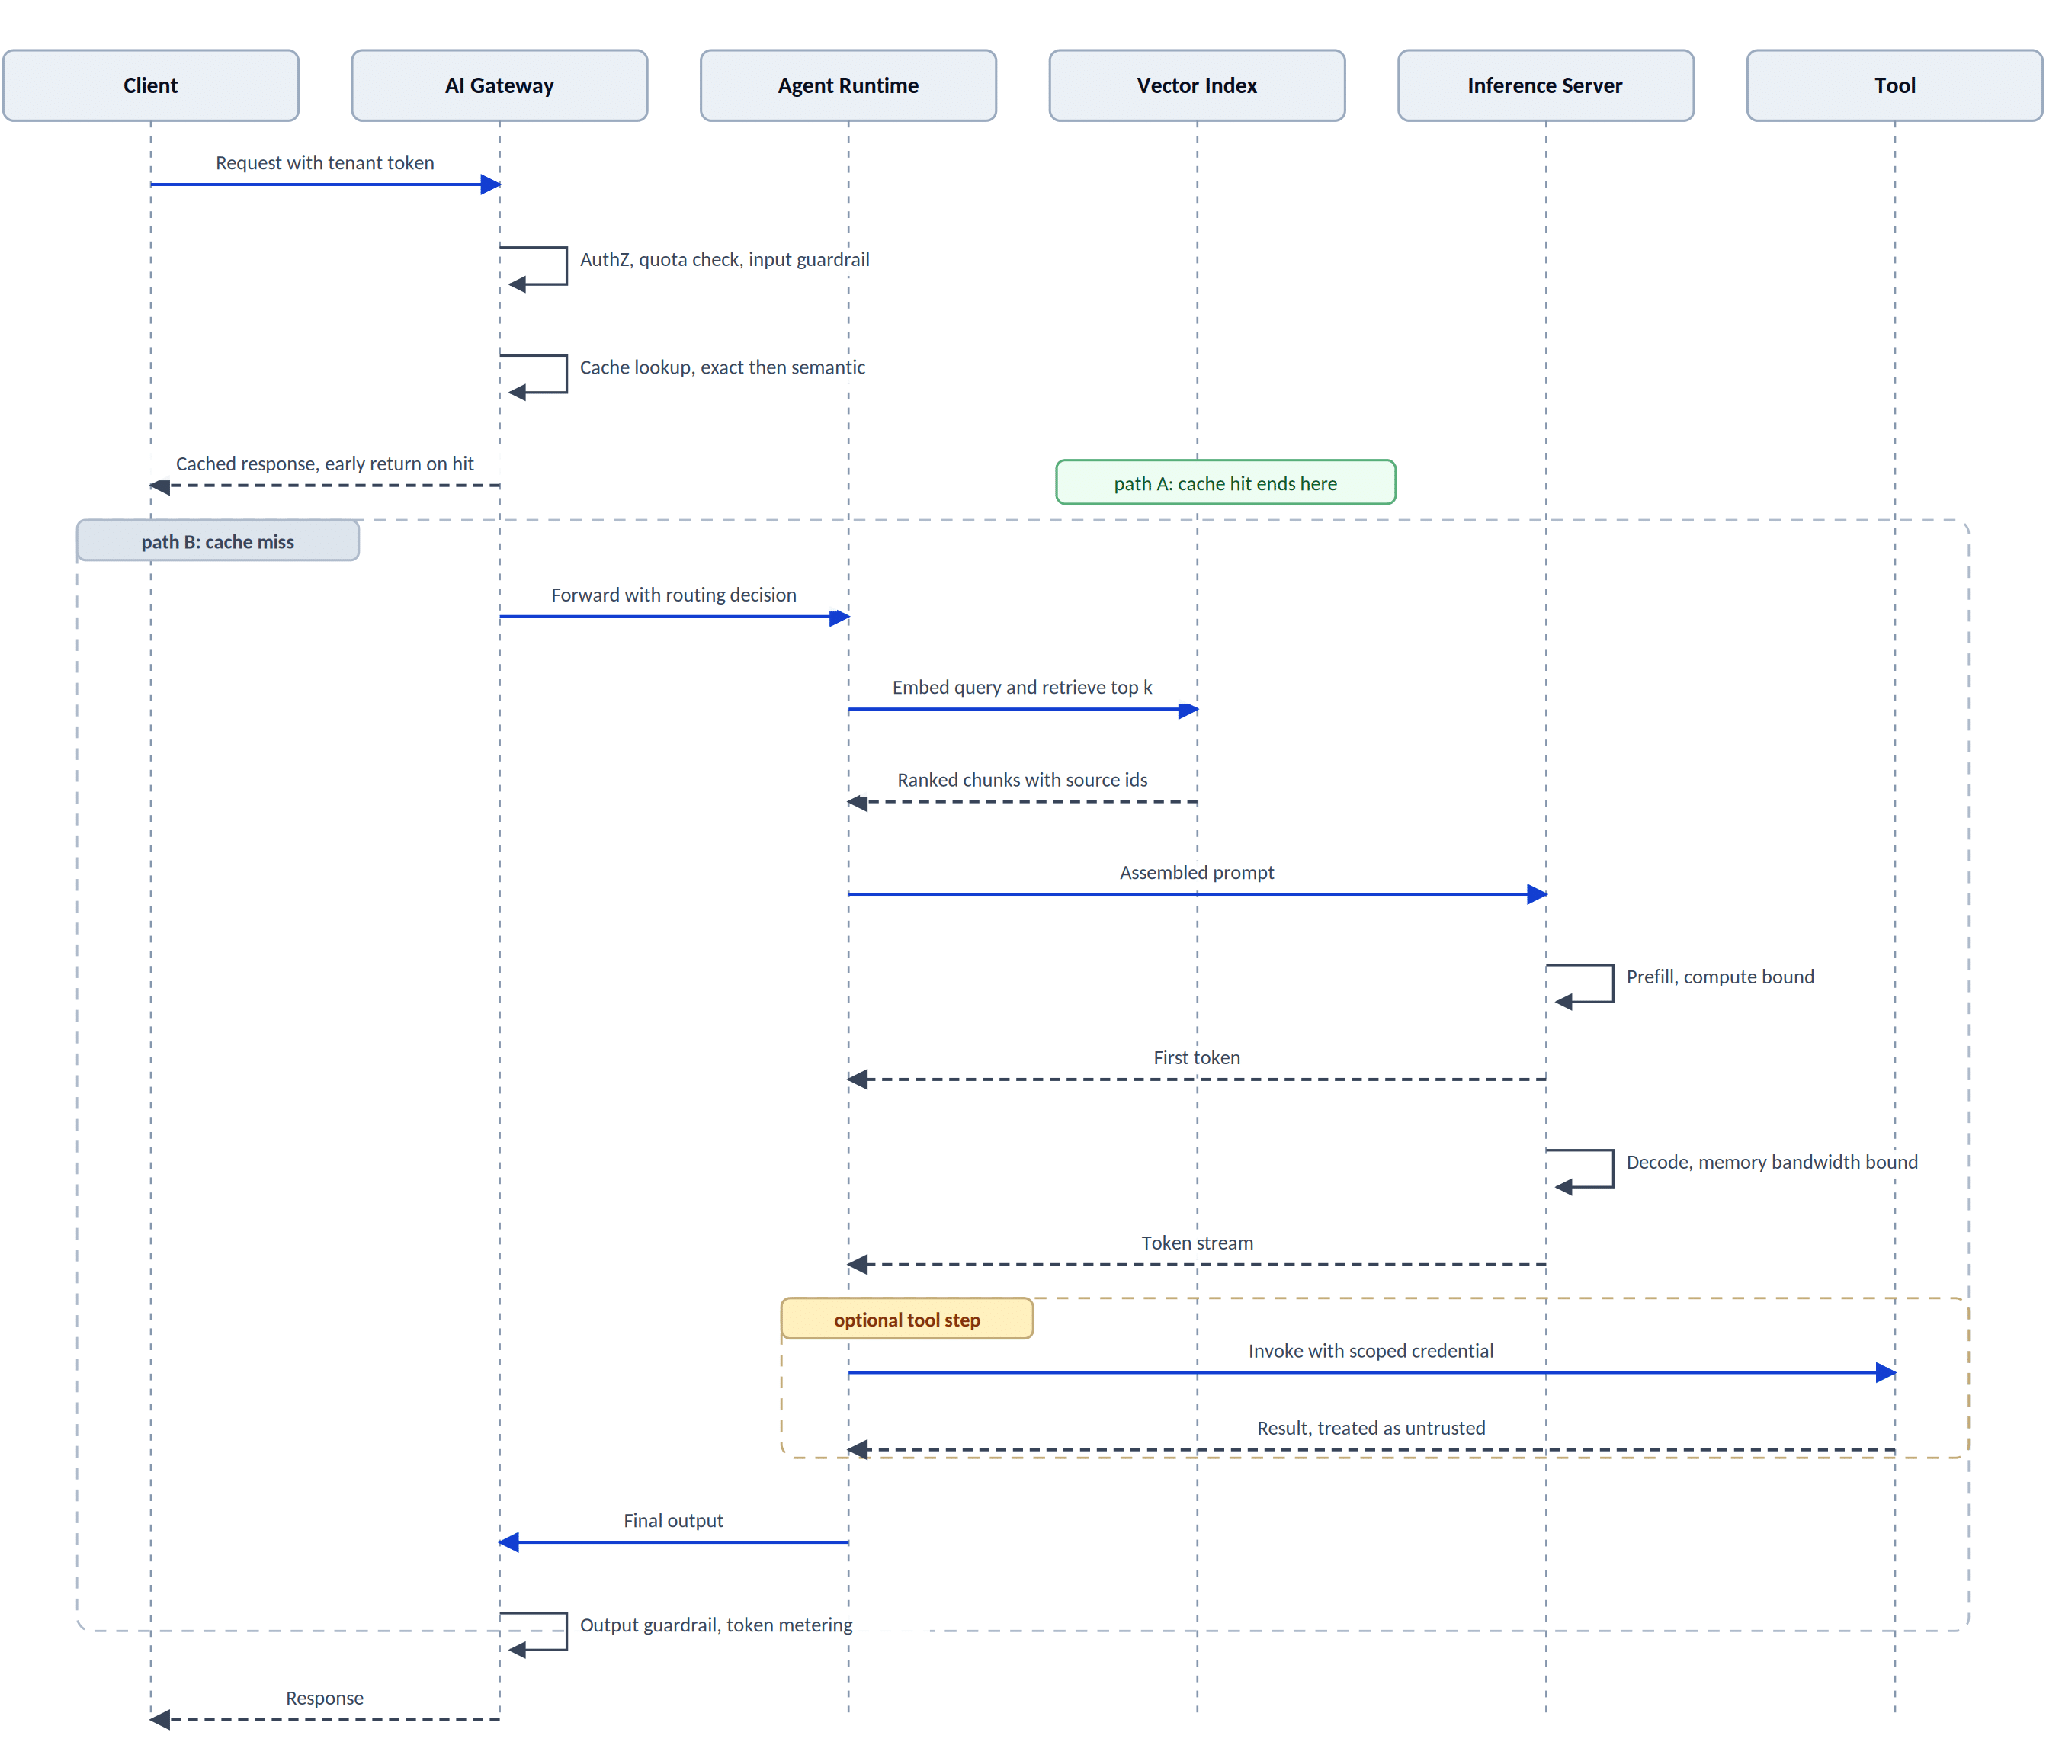
The cost and latency levers all sit somewhere on the request path, so it is worth tracing once end to end.
Three facts from that path explain most of what you will later see on dashboards:
- Prefill processes the whole prompt at once, is compute bound, and sets time to first token. Long context and slow first tokens travel together.
- Decode generates one token at a time, is bound by memory bandwidth, and sets the inter-token delay users experience as typing speed.
- The key value cache holding attention state for every active request grows with context length and consumes GPU memory.
That third point is the one to keep. Concurrency on an inference server is limited by memory, not by CPU, so when the cache fills, tail latency degrades sharply rather than gradually.
What has to be versioned and deployed?
A conventional service has code and config. An LLM service has at least eight things that change behaviour in production, and a change to any one of them is a deployment:
- Model weights and version, plus the quantization and engine config used to serve them.
- Prompt templates and the tool schemas the model is allowed to call.
- The embedding model, the chunking rules, and the index built from both.
- Guardrail policies and the evaluation datasets that define what passing means.
The embedding model bites hardest. Vectors from one model are not comparable to vectors from another, so swapping it invalidates the entire index. If rebuilding ten million chunks takes six hours, that belongs in a runbook long before someone proposes the upgrade in sprint planning.
Common advice says to treat prompts as code. That is half right. A prompt without an evaluation set is untested code, and untested code in a non-deterministic system is closer to a configuration guess than a change you can defend in a postmortem.
Hardware scheduling has caught up. Dynamic Resource Allocation reached general availability in Kubernetes 1.34 (released August 2025) and is on by default from 1.35, letting workloads declare the device attributes they need instead of an opaque GPU count. One thing to resist: self-service on accelerator quota.
How do you observe a probabilistic system?
Three audiences need three views, and a single dashboard serving all of them will serve none.
| Plane | Representative signals | Question it answers |
| Accelerator | Memory used, bandwidth utilisation, tokens per second per GPU | Is the hardware earning its cost? |
| Serving | TTFT, inter-token latency, queue wait, KV cache utilisation, prefix cache hit rate | Is the model server keeping up? |
| Application | Tokens by tenant and model, cost per request, tool failures, guardrail blocks, eval scores | Are users getting good answers at a sane price? |
Here are the signals that predict user pain:
- GPU utilisation percentage is the most misleading number in the stack, because it reports whether any kernel ran rather than whether the device did useful work.
- Queue wait time is the leading indicator, since time to first token rises non-linearly once requests wait for cache capacity.
- End-to-end averages hide streaming stalls, because a response that pauses halfway does complete eventually.
- Goodput, the rate of requests served within SLO, is the figure that tells you when to add capacity.
A server can sit at 95 percent utilisation while producing a fraction of its possible tokens per second, so you must track tokens per second per accelerator alongside it.
How do you trace a request end to end?
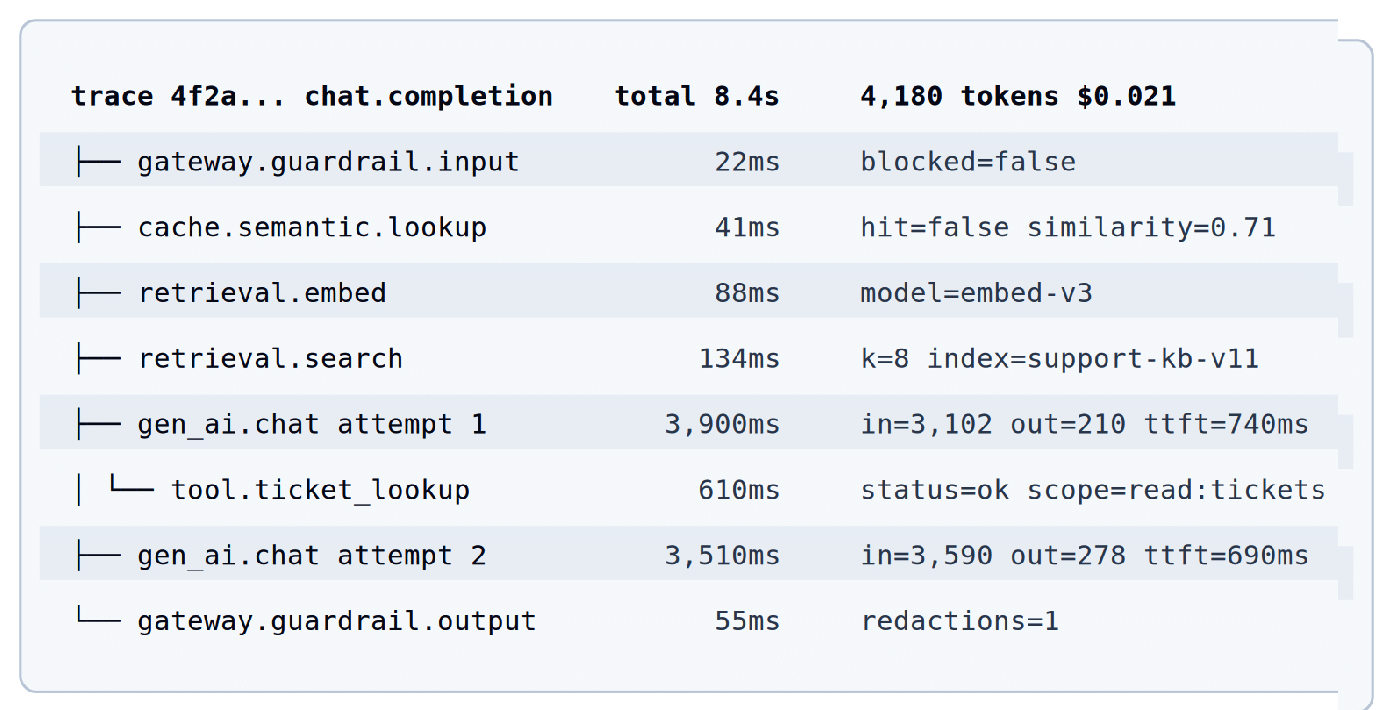
One user question can fan out into a retrieval call, three model calls, and two tool invocations. The interesting question is always which of those consumed the time and the tokens.
The vendor-neutral way to produce that structure is the OpenTelemetry genAI semantic conventions, which standardise span names, token attributes, and metrics so an LLM call looks the same regardless of which library emitted it. OpenTelemetry graduated from the CNCF in May 2026. Adopt the conventions with your eyes open:
- They remain in development status as of mid-2026 and moved to a dedicated repository in the v1.42.0 release of June 2026, which changed release cadence rather than granting stability.
- Pin the convention version and the instrumentation packages, then inspect a stored trace rather than trusting a documentation example.
- Leave prompt and completion content uncaptured by default, store it separately with its own retention and access controls, and sample rather than capturing everything.
Quality needs its own signals. Automated evaluators score a sample of live traffic, and implicit signals, such as retries, edits, and escalations to a human, cost nothing to collect. Using a model as judge means paying for a second inference and inheriting its variance, so sample rather than judging everything.
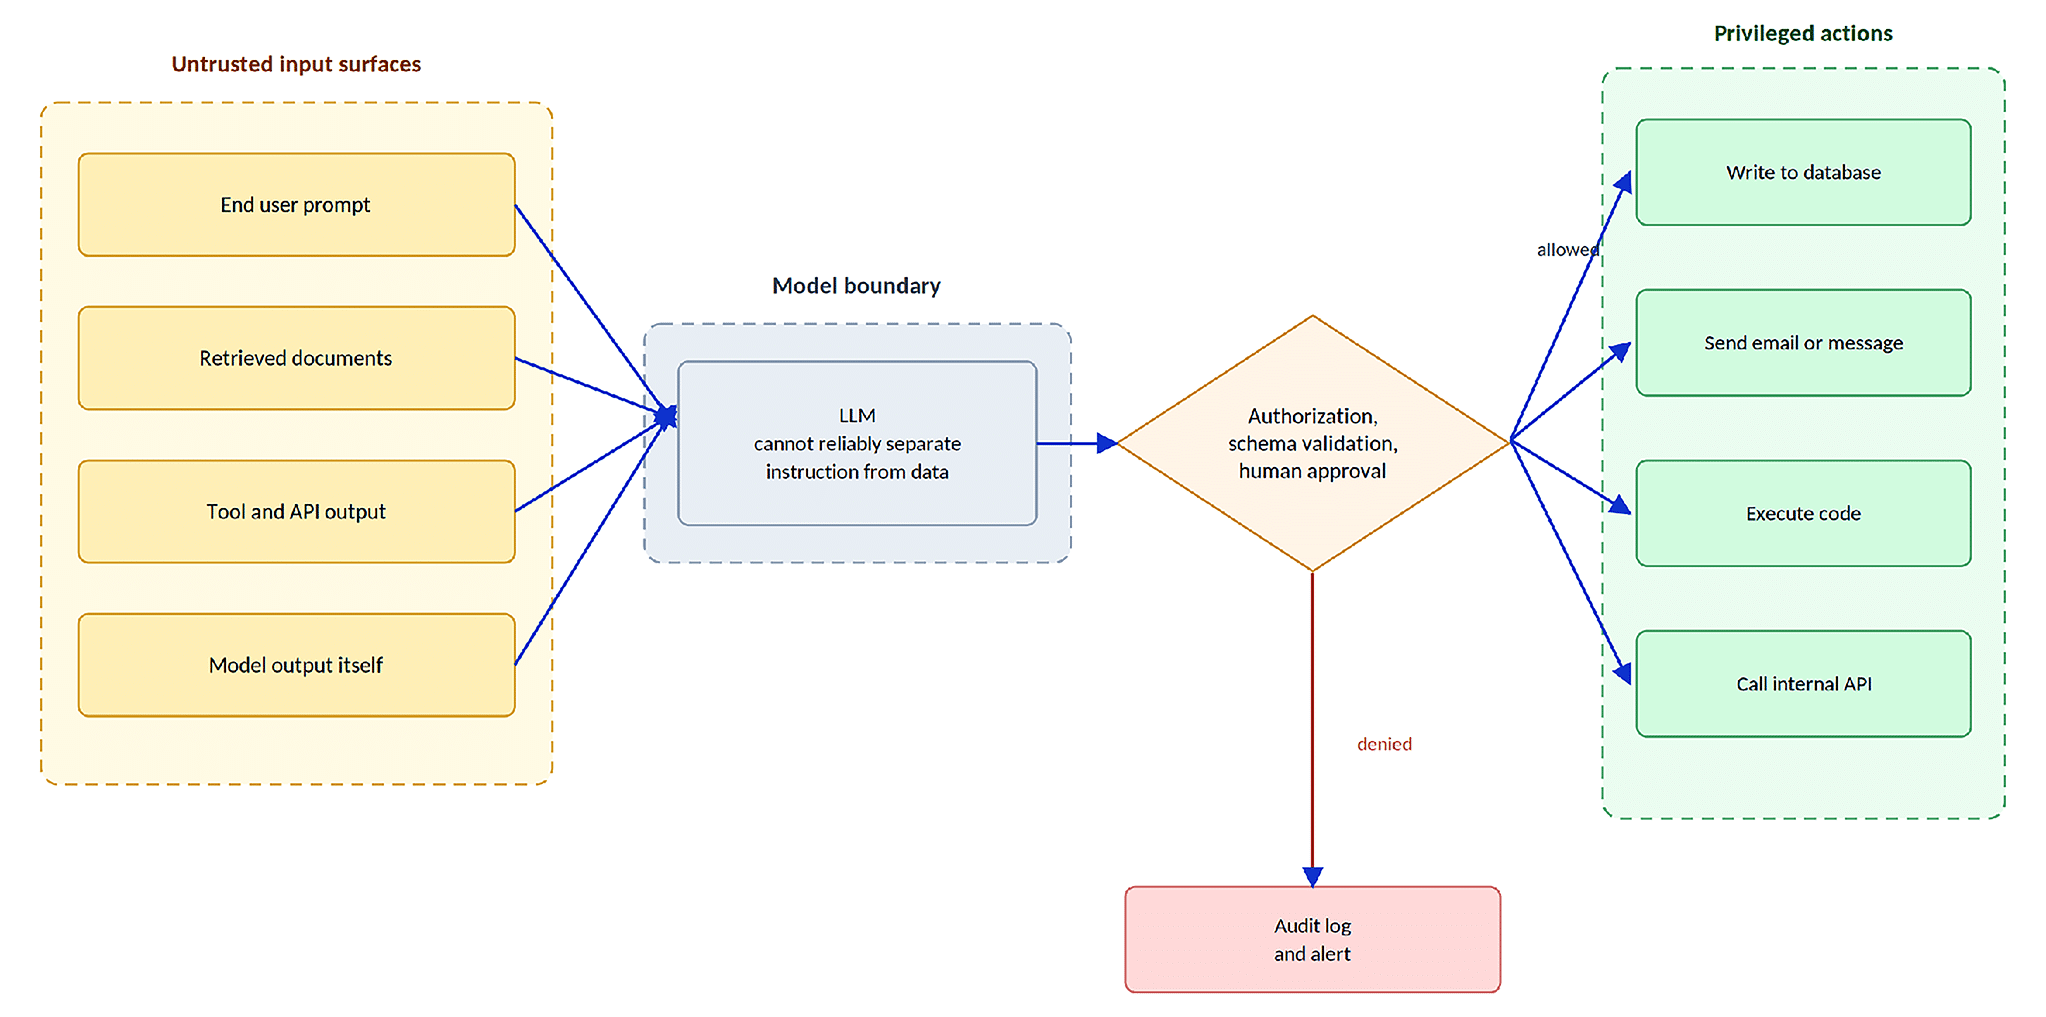
The most useful first step to secure an LLM application is drawing the trust boundaries, because the intuitive drawing is wrong (Figure 4).
Prompt injection has no single fix
Prompt injection has held the top position in the OWASP Top 10 for LLM Applications since the list began, and the 2025 edition keeps it at LLM01. The reason is structural: models receive instructions and data through one channel with no reliable separation.
Direct injection is the familiar version. Indirect injection is the dangerous one, where an attacker plants instructions inside a document or a support ticket, and they execute when retrieval pulls that content into context. Since no filter catches everything, design so that a successful injection cannot accomplish much:
- Scope every tool credential to least privilege and authorise downstream calls as the end user rather than as a shared agent identity.
- Validate output against a schema before anything acts on it, and never pass model output into an interpreter, a shell, or a query untreated.
- Require human approval for actions that move money, send external communication, or delete data.
- Restrict outbound network access from tool sandboxes to an allowlist, which turns many exfiltration attempts into blocked connections.
- Cap loop depth, tool calls, and output tokens per session, because unbounded consumption is both denial of service and denial of wallet.
The model supply chain is a binary supply chain
Model files are executable artifacts. Serialisation formats based on Python pickle can run arbitrary code at load time. This is not theoretical, and documented CVEs have covered remote code execution when loading untrusted models. Scanners have their own weaknesses, with bypass vulnerabilities in a widely used pickle scanner disclosed in late 2025.
Build an ingestion gate and make it the only path into production:
- Prefer formats that cannot execute code during deserialisation, such as safetensors, and refuse pickle-based artifacts unless there is a documented exception.
- Verify provenance cryptographically. Sigstore-backed model signing gives you a tamper-evident record of who produced the artifact.
- Scan artifacts and their dependency graph, then record the result as an attestation rather than a one-time check.
- Publish an AI bill of materials capturing model lineage, training data description, and evaluation results, using the ML-BOM extensions now present in the major SBOM formats.
- Mirror approved models into an internal registry and block direct pulls from public hubs in production networks.
The dependency side matters as much as the weights. Package ecosystems around ML tooling have been targeted through dependency confusion and through package names hallucinated by coding assistants, which attackers then register.
Policy as Code at the admission boundary
Written standards do not stop a pod from starting. Admission policy does.
Two open source engines dominate. Both are worth understanding because they fit different teams.
| Dimension | OPA with Gatekeeper | Kyverno |
| Policy language | Rego, general purpose | YAML, Kubernetes native |
| Learning curve | Steeper | Lower for Kubernetes teams |
| Scope | Kubernetes and beyond | Kubernetes focused |
| Mutation support | Available | First class |
| Best fit | Policy shared across systems |
Cluster guardrails and defaults |
A representative rule for an inference workload looks like this.
apiVersion: kyverno.io/v1

kind: ClusterPolicy

metadata:

name: restrict-model-sources

spec:

validationFailureAction: Enforce

rules:

- name: models-from-internal-registry-only

match:

any:

- resources:

kinds: [“Pod”]

namespaces: [“inference-*”]

validate:

message: “Model artifacts must come from the internal registry.”

pattern:

spec:

containers:

- image: “registry.internal.example.com/*”

env:

- name: MODEL_URI

value: “s3://models-approved/*”
Useful companion policies are: deny pods in inference namespaces without a cost-attribution label, require a resource claim rather than a bare GPU count, block egress-enabled tool sandboxes outside an allowlisted namespace, and require a signature attestation on any image that loads model weights.
How do you control the cost of inference?
Inference cost scales with usage and lands in gross margin. Most teams reach for model selection first because it feels like the engineering lever, then find that caching and prompt structure return more, sooner, with less risk.
So where does the money actually go?
- Continuous batching is the highest-return change on a self-hosted stack, commonly delivering two to three times the throughput of static batching.
- Quantization increases the batch size that fits in a given GPU, and the only trustworthy way to judge the quality cost is your own evaluation set.
- Spot capacity suits evaluation runs and batch scoring, and suits interactive serving poorly, because reloading tens of gigabytes of weights after a preemption is not recoverable within a user’s patience.
- Scale to zero fails for the same reason, so keeping one replica warm per model with daytime traffic usually beats saving a few dollars an hour.
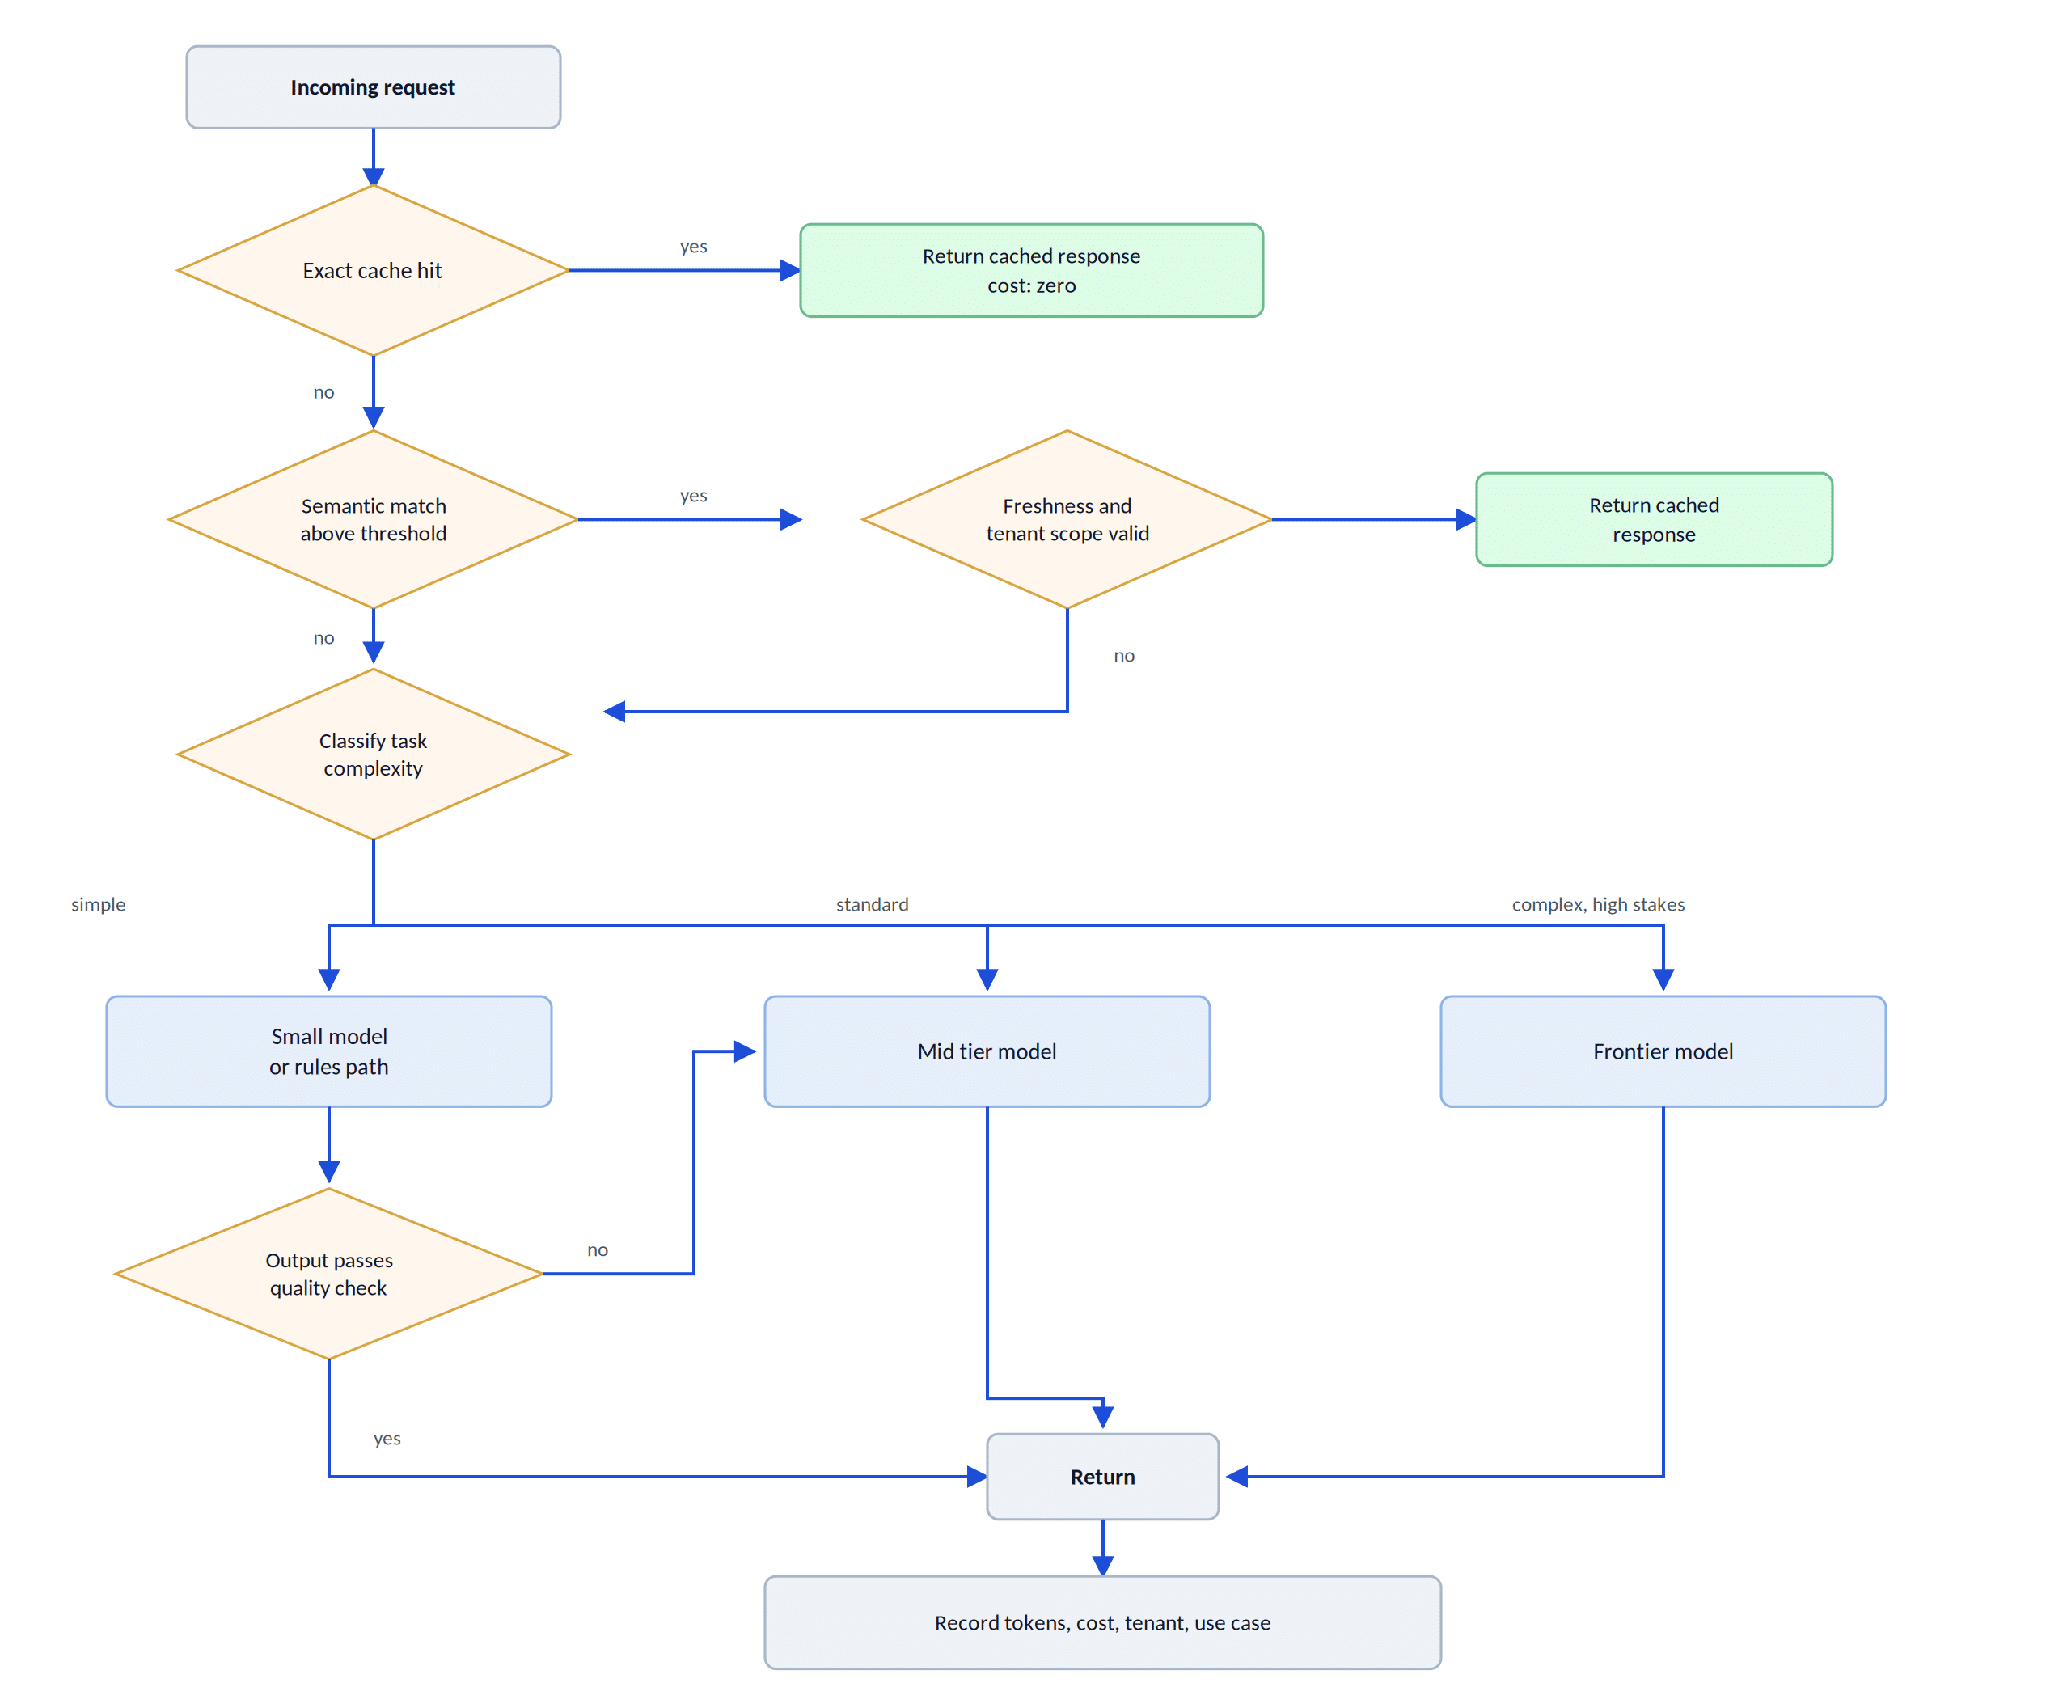
Two newer patterns are worth tracking. Disaggregated serving splits prefill and decode into independently scaled pools, and prefix-aware routing sends each request to the replica already holding a matching cached prefix. The Kubernetes Gateway API Inference Extension does exactly that, scoring endpoints on queue depth and cache locality instead of round robin.
Why should you route before you generate?
The cheapest inference is the one you do not run.
Routing needs three things: a classifier or rule set, an evaluation set proving cheaper paths hold quality, and observability to catch drift. Without the evaluation set, routing is a quality regression you have not measured yet.
Cache at several levels
Caching is not one technique. It is four, with different hit profiles and different failure modes.
| Cache layer | What is stored | Where it helps | Main risk |
| Exact response | Output keyed on prompt hash | High-repetition workloads | Stale answers when data changes |
| Semantic | Output keyed on embedding similarity | Paraphrased questions | False hits when threshold is loose |
| Provider prefix cache | Repeated static prompt prefix | Long system prompts, few-shot examples | Needs stable prompt ordering |
| KV prefix reuse | Attention state on the replica | Multi-turn conversations | Needs cache-aware routing |
Semantic caching fails in the most interesting ways, because similarity is not equivalence and small wording changes carry large intent changes. Set the threshold conservatively, scope keys by tenant, and log near misses so you can tune with evidence.
What should FinOps actually measure?
Cost per token is an accounting metric. It falls when you switch to a cheaper model even if that model needs three attempts to get the answer right. Cost per successful task captures retries, escalations, and quality failures in one number.
- Tag every request at the gateway with team, use case, model, and environment.
- Design those tags before the first production call, since they cannot be added retroactively without breaking continuity.
- Alert on rate of spend rather than monthly totals, because a runaway agent loop can burn a month’s budget long before a cumulative threshold fires.
How do you ship model and prompt changes safely?
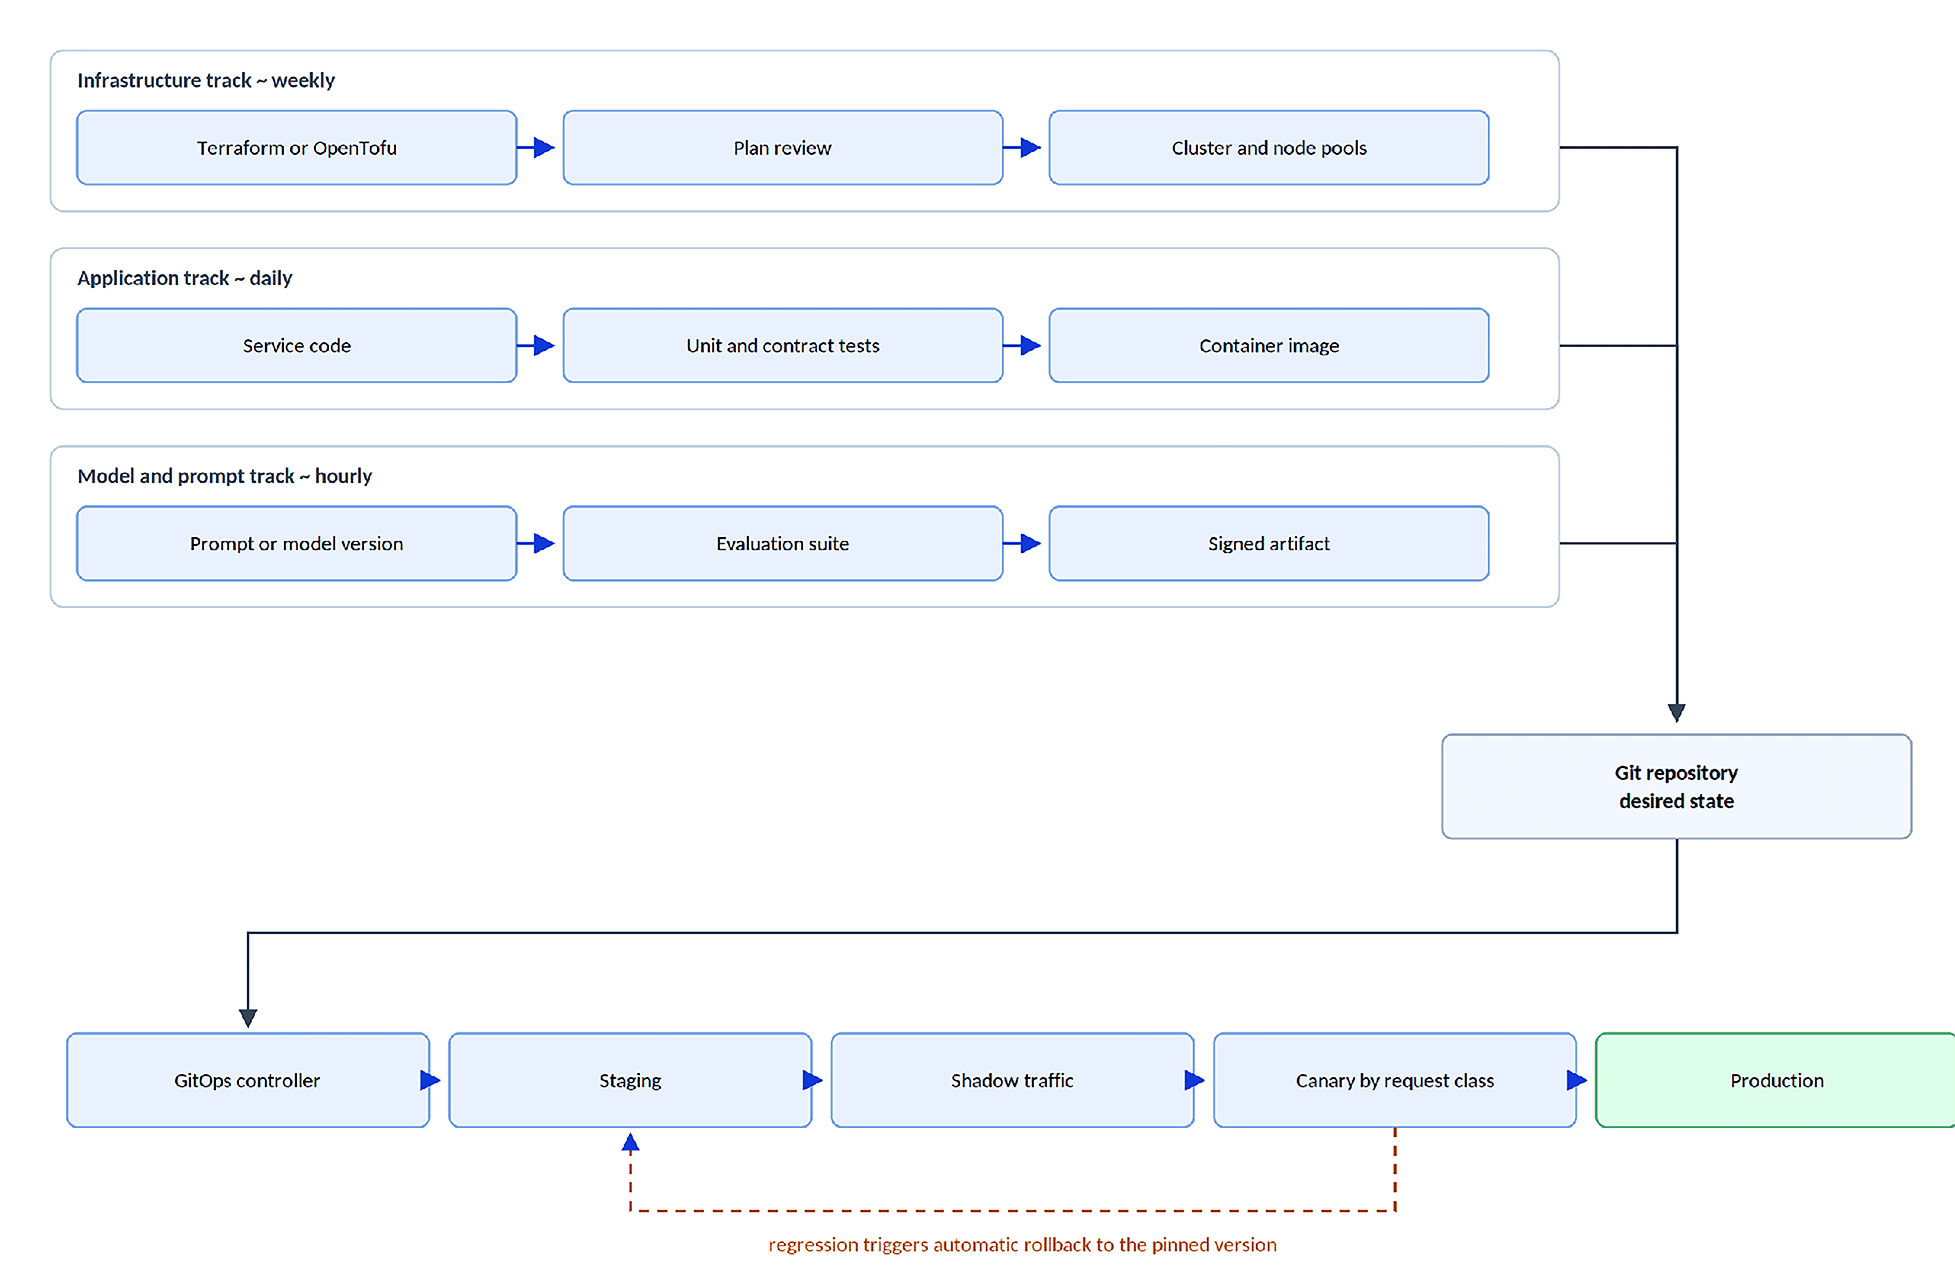
LLM platforms need three delivery tracks running at different cadences against one declared state.
What changes is the promotion gate:
- Alongside tests and security scanning, the pipeline blocks on evaluation thresholds, projected cost per task, and canary quality signals.
- Shadow traffic compares two model versions on identical production inputs without exposing users to either result.
- Canary by request class beats canary by percentage, because routing all queries of one low-risk type reveals more than five percent of everything.
- Rollback needs the previous model pinned and warm, with the prompt versioned alongside it, since the pair was evaluated together.
What changes when you run it in production?
Conventional high availability assumes you can add a replica. With accelerators, redundancy means paying for an idle GPU, so multi-provider fallback at the gateway is usually cheaper insurance than duplicate capacity, provided the path is exercised. Untested failover is a hypothesis, not a control.
A degradation ladder, agreed in advance and implemented at the gateway, converts a hard outage into a slower service.
| Level | Trigger | Behaviour |
| 1 | Queue wait above target | Reduce max output tokens, trim retrieval k |
| 2 | Primary model degraded | Route to secondary provider or smaller model |
| 3 | Sustained capacity shortfall | Serve cached answers for common intents |
| 4 | Inference unavailable | Disable AI paths, expose underlying tools directly |
Level 4 matters more than it seems to. If the product has no non-AI path, an inference outage is a full product outage, which is a decision worth making deliberately.
Regulated deployments need one more thing: an immutable record linking the request, prompt and model version, retrieved document IDs, tool calls, output, and any approver.
Which failure patterns show up most often?
Most of these are observability failures first. Each was detectable earlier with a signal the platform was not collecting.
| Pattern | Underlying cause | Fix |
| Green dashboards, unhappy users | Streaming stalls hidden by end-to-end averages | Measure TTFT and inter-token latency separately |
| High utilisation, low output | Small batches, memory bandwidth bound | Continuous batching, tune KV cache size |
| Retrieval quality collapse | Embedding model changed without reindex | Version the embedding model with the index |
| Provider outage takes everything down | Fallback configured but never tested | Scheduled failover exercises |
Where should you start?
Sequence matters more than completeness:
- Put the gateway in first, because it gives you identity, metering, routing, and a kill switch in one component, and every later control has somewhere to live.
- Instrument to the genAI conventions next, with content capture off.
- Build the evaluation suite third, since it is the prerequisite for routing, caching, and any model change you want to make safely.
- Optimise cost last, because caching and routing without evaluations is optimisation without a safety net.
The honest caveat is that this order is slower than shipping against a provider API and dealing with the platform later. Plenty of products started that way. The difference shows up at the third or fourth AI service, when nobody can say which team is spending what, or what an agent could reach if asked nicely enough.
The discipline that made microservices manageable still applies. It just has to account for workloads that cost per token, hold state in GPU memory, treat their input as instruction, and answer differently to the same question twice.