






























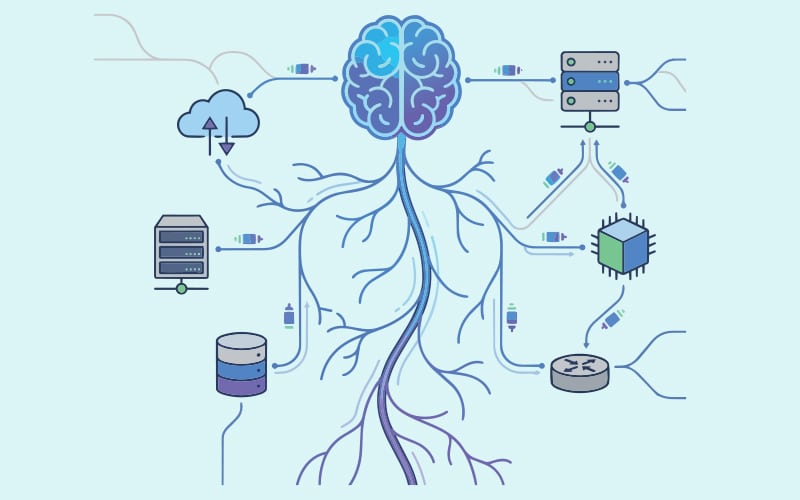

Observability serves as the critical nervous system of contemporary digital infrastructure, enabling organizations to monitor, measure, and understand the intricate behaviors of their systems. By providing comprehensive insights Observability helps turn operational data into knowledge that enables resilient, efficient, and intelligent digital systems.
Modern digital services run across cloud platforms, containers, microservices, edge devices, and now, increasingly, artificial intelligence workloads. Traditional monitoring tools, built for infrastructures that are more predictable, often fail to make it clear what the root cause of a breakdown was, especially inside these complicated setups. That’s why observability has moved from being a nice technical add-on to a strategic necessity pretty quickly.
Observability is basically the practice of understanding a system’s internal state by looking at the data it produces. If organisations collect and connect metrics, logs, traces, and other telemetry signals, they can go further than stating “something broke.” They can figure out why it broke. And that is crucial for keeping reliability high, making the user experience better, and helping teams innovate faster without losing control.
The open source ecosystem has become a major player in this field. Prometheus, OpenTelemetry, Grafana, Loki, and Tempo give organisations flexible, scalable, vendor-neutral options for monitoring modern applications. Put together, these tools can act like full observability platforms, and can support cloud-native systems, AI workloads, and edge computing environments too.
When systems speak: Why observability has become mission-critical
Modern digital systems very rarely run as one tidy application. More often, they show up as distributed ecosystems — full of APIs, microservices, databases, and external hookups. A single user request can end up jumping across dozens of pieces before it finishes its lifecycle — so failure analysis gets way more tangled, especially when everything looks normal at first.
Most traditional monitoring tools still centre on fixed thresholds—like CPU usage, memory consumption, or overall uptime. It helps, surely. But it doesn’t really tell you why something weird happens in a distributed setup. Observability kind of fills that gap, because engineers can infer what’s going on, based on telemetry signals rather than just alerts.
Metrics show movement over time, logs add the context you need, and traces lay out the path of a request across services. Put these together and you can often rebuild system behaviour even when failures arrive like a surprise guest.
Take a delayed checkout flow in an e-commerce platform. At first glance it may not scream the root cause — just a slow page. With observability, you can see if the latency comes from payment services, inventory APIs, or some third-party dependency that’s acting up somewhere in the middle.
service: checkout-api
latency_threshold: 200ms
error_rate_threshold: 1%
As systems grow, observability becomes important, not only for engineering teams, but for business continuity too. When you can understand system behaviour, directly, it affects revenue, customer confidence, and day-to-day operational stability.
And with all these services interlocking so tightly, there’s this more pointed question underneath it all: how do we go from basic, surface-level visibility to something more structured, like a real understanding of system behaviour?
Beyond dashboards: Understanding modern observability
Early monitoring setups tended to lean on dashboards that show system health in (near) real time. Sure, dashboards are still useful, but they’re kind of boxed in— they tell you what is going on, yet most times they don’t really say why.
Observability flips the story. Instead of treating system comprehension as a bunch of prebuilt panels, it treats it like a property you can derive from what the system outputs. The basic notion is that even if you can’t directly see internal states, you can infer them from external behaviour.
The classic trio — metrics, logs, and traces—kind of acts like a combined lens. Metrics give numerical patterns, logs hold distinct moments, and traces lay out how requests travel across multiple services.
But modern observability doesn’t stop there. Event streams, user experience measurements, and security-oriented signals now join the mix to help explain system behaviour.
{
“service”: “recommendation-engine”,
“latency_ms”: 142,
“trace_id”: “trace-9f21”,
“cache_hit”: true
}
In practical environments—like streaming platforms or fintech stacks—observability helps teams stop living in reactive mode. Rather than only asking “what failed?”, people can dig into “what changed in system behaviour?”
That change turns day-to-day ops into more investigative analysis, where weird unknown issues can be studied without locking yourself into some fixed hypothesis from the start.
As systems evolve further into cloud native designs, figuring out how these signals are gathered, normalised, and structured becomes downright essential.
The anatomy of an open source observability stack
Open source observability has become the backbone of modern infrastructure monitoring because it feels flexible and easy to extend. Rather than depending on one big monolithic tool, most groups end up building modular stacks that match what they need.
The observability architecture usually sits in four somewhat obvious layers: instrumentation, collection, storage, and visualisation. Each of those layers plays its own part in turning raw telemetry into insights you can use.
Instrumentation is most often done with OpenTelemetry; it standardises how metrics, logs, and traces are produced. After that, the data gets sent to different specialised backends, and those backends are optimised for each telemetry kind.
A common setup looks like what is show in Figure 1.
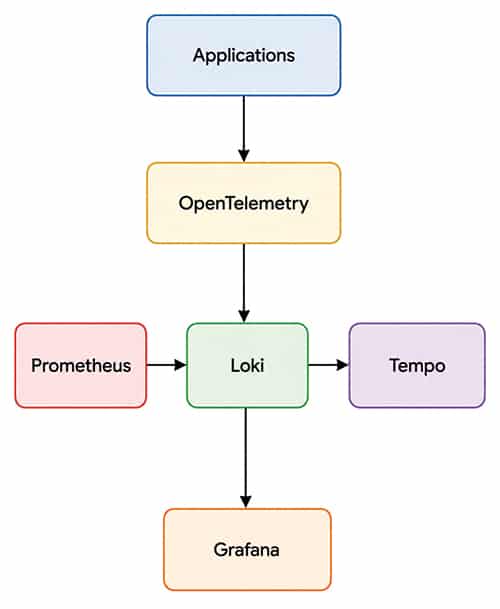
This modular idea lets every system scale on its own, while still staying interoperable. It is also why big SaaS providers and financial institutions go for the same overall pattern: it reduces vendor lock-in, and it plays nicer with hybrid cloud deployments. Plus, teams can refresh or upgrade one piece of the pipeline without causing a full disruption to everything else, which is honestly a big deal.
And as telemetry volume increases, the pressure for efficient metric collection only keeps growing.
Metrics at scale: The role of Prometheus and modern telemetry
Metrics really are like the base layer for observability, turning what the system does into numbers, which you can then sum up and compare as time goes on. They are lightweight, can scale well, and are great when you want to watch systemwide trends in a clean way.
Prometheus is now basically the default choice for metrics collection in cloud native setups. The whole pull-based idea means it scrapes metrics from services that change a lot, which is why it works so well for Kubernetes clusters, and all that dynamic stuff around them.
http_requests_total 15432
request_duration_seconds 0.182
active_sessions 2341
But it doesn’t stop at infrastructure monitoring. Modern telemetry stacks also pull in business-oriented metrics, like transaction volumes, user interaction signals, and reliability related indicators. That gives engineering teams a way to line up technical performance with actual business results, not just guesswork.
For instance, an online store might examine how added delay affects checkout completion. Or a media service could compare buffering frequency with user retention and see the relationship instead of relying on intuition.
Still, as systems become more fluid and spread across more nodes, metrics by themselves get a bit thin. You typically need logs too, so you can get the context behind those numerical patterns and understand what’s happening.
From log chaos to actionable insights
Any time a service talks with another service—API requests, database lookups, authentication tries—it usually leaves log trails behind. In today’s distributed setups this piles up fast, like terabytes each day, so just staring at raw logs is basically not workable.
The real pain isn’t gathering the logs, it’s making sense of them. Plain text logs tend to be kind of messy, so during an incident engineers end up scrolling, searching, and re-scanning unstructured stuff, which is hard enough on a normal day, but worse when everyone is under pressure. That reactive workflow drags out diagnosis, and can add up to longer downtime.
Observability today tries to push logs towards structured, queryable events. Once log formats are standardised, the whole system can correlate what’s happening across different components, over time, instead of treating everything like separate islands.
{
“timestamp”: “2026-06-06T10:15:00Z”,
“service”: “payment-api”,
“level”: “ERROR”,
“event”: “transaction_failed”,
“user_id”: “7821”,
“trace_id”: “abc-123”,
}
And when those logs are enriched with trace identifiers, they suddenly feel way more useful. You can jump from a metric oddity straight to a trace, and then further down into the exact log entries that explain what went sideways.
In real systems, like fintech or healthcare apps, structured logging shortens the mean time to resolution because it gives sharp contextual hints. Instead of reading logs by hand, teams can just slice the data by service, request, or transaction ID and move on.
Finally, as log records get more structured and more connected, they naturally feed distributed tracing tools. Those tools then stitch together individual events into a full ‘request journey’, so the story of the failure becomes easier to follow, even when it spans many services.
Following the digital breadcrumbs: Distributed tracing with OpenTelemetry
In distributed architectures, one user request usually wanders across multiple services before it’s done. But if you do not get visibility into that whole trip, figuring out why latency spikes or where a failure happens gets hard.
Distributed tracing helps by following a request as it spreads through the different services. Each step gets logged as a span, and those spans together turn into a trace that shows the full transaction story from start to finish.
OpenTelemetry has become the de facto standard for creating and exporting trace data. It gives you one common framework that works across languages, platforms, and even across different cloud setups.
from opentelemetry import trace
tracer = trace.get_tracer(__name__)
with tracer.start_as_current_span(“checkout”):
process_payment()
update_inventory()
In real production environments, tracing often exposes weird or unexpected bottlenecks. An e-commerce platform may notice that checkout feels slow not because of payment processing, but because an external recommendation service adds extra latency.
That kind of clarity matters a lot in microservices setups, where dependencies are often hidden and can change over time. Tracing lets engineers replay the request pathway and spot inefficiencies that would have otherwise stayed invisible.
As systems get more connected and interdependent, tracing acts like the connecting bridge that links metrics and logs into one investigative view.
The observability control centre: Visualising everything with Grafana
Raw telemetry data turns into something meaningful only when it can be interpreted in a way that helps people. Visualisation platforms matter a lot here, because they turn those tangled datasets into operational views that are easier to grasp, even when things get messy.
Grafana has become one of the more adopted tools for this purpose. It connects with several data sources so teams can show metrics, logs, and traces together in one place — like a shared screen for everyone.
When the dashboard is built well, it gives near real time understanding of system health, pulling together infrastructure, applications, and business indicators in a single view.
dashboard:

panels:

- CPU Usage

- Request Latency

- Error Rate

- Revenue Per Minute
In the real world, these kinds of dashboards show up a lot during busy moments like online sales, or when a product launch goes live. Engineering teams keep an eye on system behaviour as it happens, while product and business folks watch user engagement and revenue impact side by side.
Grafana also supports cross teamwork because it gives people a shared operational vocabulary. Rather than struggling with raw logs, or staring at isolated metrics, everyone can work from one common visual context. So as visualisation becomes the core of day-to-day choices, observability shifts from being just a backend engineering concern into more of an organisation-wide skillset.
Observability for cloud-native, AI, and edge workloads
Cloud-native setups, AI models, and edge devices add extra layers of complexity that the older observability methods struggle to map correctly. Honestly, it’s messier than people expect.
Cloud-native systems are very dynamic, with containers scaling up or down within seconds, and sometimes it feels like everything is moving at once. So observability tools need to adapt in real time, not just when something is already broken.
AI systems bring their own set of headaches. Besides usual infrastructure metrics, teams also need to watch model performance, inference latency, and prediction quality.
{
“model”: “fraud-detection-v3”,
“inference_ms”: 38,
“confidence”: 0.91
“drift_score”: 0.12
}
Edge environments make observability even more awkward. Limited connectivity, plus distributed deployment locations, means telemetry must be handled carefully. Sensors, IoT systems, and industrial controllers must send data efficiently, but not flood the networks, or at least not all at once.
In fields like manufacturing and logistics, observability is what helps physical and digital components stay reliable. If sensor readings come in late or model inference drifts, it can cause real world operational trouble, even if the dashboards look “mostly fine” for a minute.
So as computing keeps decentralising, observability must evolve to deliver consistent visibility across these different, heterogeneous environments.
Building a production-ready open source observability platform
Building a production-grade observability system means way more than dropping in tools. It needs architectural choices that juggle scalability, reliability, and cost efficiency all at the same time.
In most real deployments the telemetry pathway gets split into a few layers –ingestion, processing, storage and, finally, visualisation. That separation lets each part scale on its own without dragging the rest of the stack along with it.
Apps → OpenTelemetry → processing pipeline → Storage (Metrics Logs Traces) → Grafana
At the organisational level, teams also have to think about retention periods — who can access what, and whether there is high availability. Keeping every single telemetry signal forever is not practical, nor is it usually budget-friendly. So systems focus on high-value data while archiving or sampling the less crucial information.
Big enterprises frequently run multi-region observability setups to boost resilience, and to lower latency. This matters a lot for global platforms that serve millions of people across different geographies and time zones.
In the end, production observability is not merely a set of instruments. It is more like designing a system that stays dependable when load spikes happen, and when failures show up where you least expect them.
The road ahead: AI-assisted observability and autonomous operations
Observability is moving from passive monitoring into something more like an active intelligence system, powered by artificial intelligence.
As telemetry volumes keep climbing past what a human can reasonably parse, AI models are being used increasingly to catch anomalies, connect related occurrences, and propose the likely underlying reasons.
if predicted_latency > threshold :
trigger_autoscaling()
Future observability platforms probably won’t stop at just detecting problems. They will also recommend or even carry out remediation steps on their own. Like rolling back a bad release, increasing capacity when demand spikes, or steering traffic along a different route.
Yet, once you add autonomy you also get the headaches about trust, explainability, and governance. Engineers have to make sure the automated systems act in a consistent, controlled, and safe way.
Still, the trajectory seems clear. Observability is sliding from reactive debugging into predictive and almost autonomous operations.
Long term, the goal feels like a setup where infrastructure can diagnose itself, refine performance, and rebound from failures, with far less human involvement.
In the end, operations will not be defined by how much data we collect, but by how well we understand it. In this world, observability is the nervous system for modern digital infrastructure, letting systems run more resiliently, adapt faster, and become more autonomous over time.