


If you are a data scientist, you need to stay abreast with everything that is happening in the field of data science. This article takes a brief look at Pandas Profiling and Streamlit – two emerging Python libraries that a data scientist should be aware of.
Data science is the buzzword these days, and Python is the language used most for it. Many new tools and libraries are emerging daily, which every data scientist should know about and use. In this article, we will take a look at two such libraries that will help a data scientist in exploratory data analysis (EDA) and model deployment.
Pandas Profiling
EDA is one of the critical steps in data science and gives users a certain level of insight and statistical measure of data. It also helps us to finalise the features for model development. Normally, we carry out EDA using Pandas and visualise data using Matplotlib, Seaborn or Bokeh, which is time consuming and requires a lot of programming skills. We can now do all of this by using the new library called Pandas Profiling.
Pandas Profiling is an open source Python library that helps to finish the standard EDA in a single line of code. It also helps to generate profile reports from a Pandas data frame. It can be saved in Web format and shared within the team to validate and understand the data.
To install it using the pip package manager, use the following code:
pip install pandas-profiling
To generate the report, type:
profile = ProfileReport(df, title=”Pandas Profiling Report”)
The following code will generate the HTML report:
profile.to_file(“report_name.html”)
The report contains the following for each column in our data set:
1. Type of columns in the data frame
2. Unique values
3. Most frequent values
4. Descriptive statistics like mean, mode, standard deviation, sum, median absolute deviation, coefficient of variation, kurtosis, skewness
5. Quantile statistics like minimum value, Q1, median, Q3, maximum range, interquartile range
6. Histogram
7. Correlations highlighting highly correlated variables; Spearman, Pearson and Kendall matrices
8. Missing values matrix, count, heatmap and dendrogram of missing values
9. File and image analysis extract file sizes, creation dates and dimensions, and scans for truncated images or those containing EXIF information
10. Text analysis — learn about categories (uppercase, space), scripts (Latin, Cyrillic) and blocks (ASCII) of text data
Streamlit
Model deployment is the process of taking the trained model to the world and allowing everyone to use it. Traditionally, the trained model is exposed as an API by using a Python Web framework like Flask or Django. This requires a steep learning curve and can be a huge burden for the data scientist who already has a lot of work pressure. Streamlit comes to the rescue, as it removes the front-end and design barriers for data nerds.
Streamlit is an open source Python library that helps to build machine learning Web apps in no time. With just a few lines of code, we are able to build an ML application and deploy it. Using Streamlit’s invite-only sharing feature, we can effortlessly share, manage and collaborate apps with team members. It is also compatible with other data science libraries like PyTorch, TensorFlow, Scikit, Plotly, Matplotlib and Bokeh.
To install Streamlit using pip package manager, type:
pip install streamlit
Streamlit provides simple APIs, which help to create many widgets. These are not limited to adding maps, charts and interactivity into apps with checkboxes, buttons and sliders, but can do much more. Given below are some of the APIs.
1 Display text:
- st.text(‘Fixed width text’)
- st.markdown(‘_Markdown_’)
- st.latex(r’’’ e^{i\pi} + 1 = 0 ‘’’)
- st.write(‘Most objects’)
- st.title(‘My title’)
- st.header(‘My header’)
- st.subheader(‘My sub’)
- st.code(‘for i in range(8): foo()’)
2 Display data:
- st.dataframe(my_dataframe)
- st.table(data.iloc[0:10])
- st.json({‘foo’:’bar’,’fu’:’ba’})
3 Display charts:
- st.line_chart(data)
- st.area_chart(data)
- st.bar_chart(data)
- st.pyplot(fig)
- st.altair_chart(data)
- st.vega_lite_chart(data)
- st.plotly_chart(data)
- st.bokeh_chart(data)
- st.pydeck_chart(data)
- st.deck_gl_chart(data)
- st.graphviz_chart(data)
- st.map(data)
4 Display media:
- st.image(‘./header.png’)
- t.audio(data)
- st.video(data)
5 Display interactive widgets:
- st.button(‘Hit me’)st.
- checkbox(‘Check me out’)
- st.radio(‘Radio’, [1,2,3])
- st.selectbox(‘Select’, [1,2,3])
- st.multiselect(‘Multiselect’, [1,2,3])
- st.slider(‘Slide me’, min_value=0, max_value=10)
- st.select_slider(‘Slide to select’, options=[1,’2’])
- st.text_input(‘Enter some text’)
- st.number_input(‘Enter a number’)
- st.text_area(‘Area for textual entry’)
- st.date_input(‘Date input’)
- st.time_input(‘Time entry’)
- st.file_uploader(‘File uploader’)
- st.color_picker(‘Pick a color’)
We can now write a few lines of code in Python to build a beautiful ML Web app with no need of back-end code, defining routes, handling HTTP requests, connecting a front-end, and writing HTML, CSS and JavaScript.
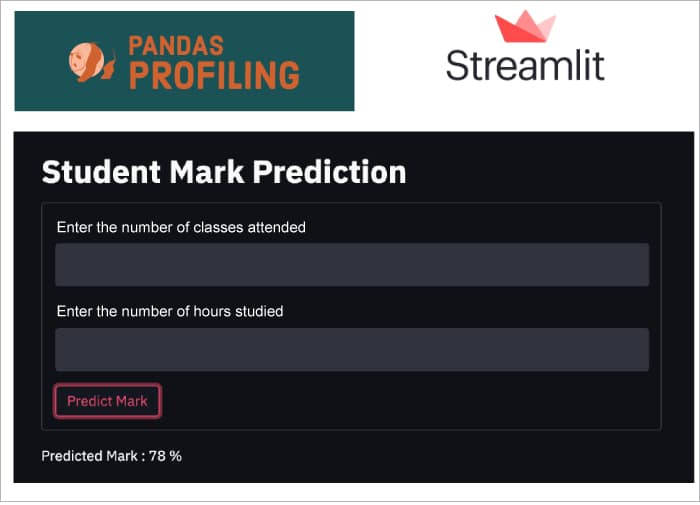
Let’s take an example. We have a regression model to predict the marks of a student based on two independent variables — ‘No. of hours studied’ and ‘No. of classes attended’.
Now, let’s build a Web app with two input boxes for the users to provide ‘No. of hours studied’ and ‘No. of classes attended’, and a button to predict the marks of a student. The code is given below:
import streamlit
import pandas
st.title(“Predict Student Marks”)
#Lets create a form
Form = st.form(key=’marks_form’)
Form.text_input(label=”Enter the number of classes attended”)
Form.text_input(label=”Enter the number of Hours studied”)
Submit_button= form.form_submit_button(‘Submit’)
If submit_button:
#load your pickle file or h5 model file
#predict output with the above input
St.markdown(“Predicted Mark :” + Mark + “%”)
To run the streamlit web app,
Streamlit run <filename>
The output of the above program is shown in Figure 1.
This is a small example that shows how to create an ML Web app using Streamlit. You can explore this library in detail at https://streamlit.io/.


