


Performance analyses of cricketers and teams playing in the Indian Premier League (IPL) can benefit immensely from a graph model. Here’s how…
Cricket analytics in the IPL (Indian Premier League) has traditionally evolved around summarisation. Batting averages, strike rates, economy numbers, and points tables provide convenient abstractions, but they compress a highly relational sport into static outcomes. Every performance in the IPL is shaped by a web of dependencies: the opposition, the batting order, the venue, team composition, and even the strategic intent of a particular season.
What often gets lost is continuity. Players move franchises, roles change, venues behave differently across years, and teams reinvent themselves every auction cycle. These are not isolated events. They are transitions, and transitions are fundamentally relational.
A graph model embraces this reality by making relationships explicit rather than inferred.
Why graph thinking fits the IPL
The IPL is not a dataset that sits still. Squads change annually, impact players alter match dynamics, and franchises experiment with long-term versus short-term strategies. Asking meaningful questions across seasons quickly becomes cumbersome in tabular systems because relationships must be reconstructed repeatedly.
Graph thinking allows analysis to begin from connections rather than records. It becomes possible to traverse how a player’s career arcs across teams, how team cores evolve, or how venue conditions interact with playing styles.
This shift enables questions such as:
- How does a player’s performance change when moving between franchises with different team cores?
- Which teams maintain structural stability across seasons despite roster churn?
- How strongly do venues influence specific player archetypes over time?
These are difficult to express cleanly without a relationship-native model.
Structuring the IPL as a graph
The graph is built around stable entities that rarely change identity:
- Players representing individual cricketers
- Teams representing IPL franchises
- Matches as discrete competitive events
- Seasons capturing tournament editions
- Venues representing stadiums
These nodes intentionally remain lightweight and descriptive rather than analytical.
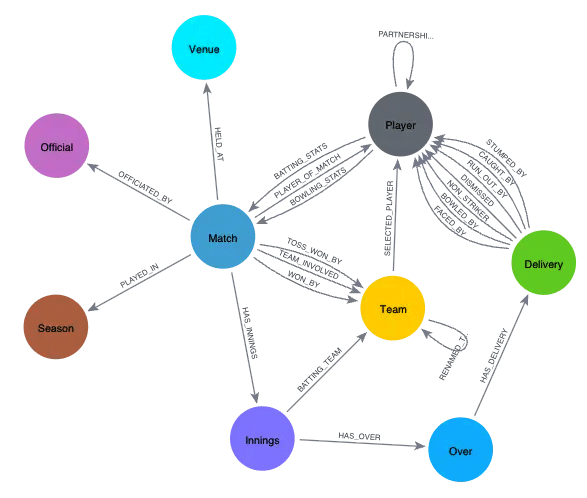
Relationship first modelling
The analytical power of the model comes from where the data lives. Instead of embedding performance metrics into nodes, they are attached to relationships where context exists.
Examples include:
- Runs scored and strike rate in the player to match relationship
- Overs bowled and wickets in the bowler to match relationship
- Team membership in a player to team relationship in a season
This approach preserves temporal correctness and prevents historical distortion when players change teams or roles.
Graph scale and infrastructure
The final Neo4j deployment contains more than 320,000 nodes and over 1.2 million relationships spanning multiple IPL seasons. At this scale, the graph reflects real tournament complexity while remaining efficient for deep traversal queries. Indexing and relationship-centric access patterns allow multi-hop queries without the join explosion typical of relational systems.
Once the IPL is represented as a graph, analysis shifts away from ranking tables and towards patterns of interaction.
Player adaptability across contexts
Rather than measuring success purely through aggregate runs or wickets, players can be evaluated on how they perform across varying conditions. Traversing player to team to venue paths reveals who adapts consistently versus who thrives only in specific environments.
Team cohesion and continuity
Team performance can be analysed through relational stability. Teams that retain a coherent player core across seasons often exhibit stronger structural signals than teams built around frequent overhauls. These patterns are visible in the density and persistence of player team relationships rather than in match results alone.
Identifying structural influencers
Graph algorithms introduce another dimension of insight. Centrality measures highlight players who act as connectors across teams and seasons. These players often influence tournament dynamics in ways not immediately visible through traditional statistics. Community detection surfaces clusters of players and venues that share similar performance characteristics, offering a data-driven view into tactical groupings.
Venues as contextual forces
Venues in the IPL are often reduced to simple labels, yet their influence is persistent and measurable. When modelled as first class entities, venues reveal how conditions shape performance over time rather than in isolated matches.
Sub-graphs anchored to specific venues expose:
- Players whose performance consistently improves or degrades at certain grounds
- Teams that rely heavily on home conditions for sustained success
- Venue-specific biases towards batting depth or bowling discipline
This shifts venue analysis from anecdotal commentary to structural evidence rooted in historical interaction patterns.
From scorecards to structures
Viewing the IPL through a graph lens reframes analysis from scorecards to structures. It enables reasoning that mirrors how the game unfolds as a network of evolving relationships shaped by context, continuity, and interaction. With hundreds of thousands of nodes and over a million relationships, the system is designed not just for historical analysis but for continuous evolution. The graph is updated as soon as a match concludes, allowing new performances, outcomes, and contextual shifts to be reflected immediately in the data model.
This foundation also enables more intuitive ways of interacting with the graph. An upcoming feature, ‘Ask BG’, introduces a natural language interface on top of the graph, allowing users to ask relationship-driven questions directly without writing queries. By combining real-time data updates with conversational access to the underlying graph, the platform moves closer to treating IPL analysis as a living system rather than a static archive, unlocking insights that traditional approaches struggle to surface.
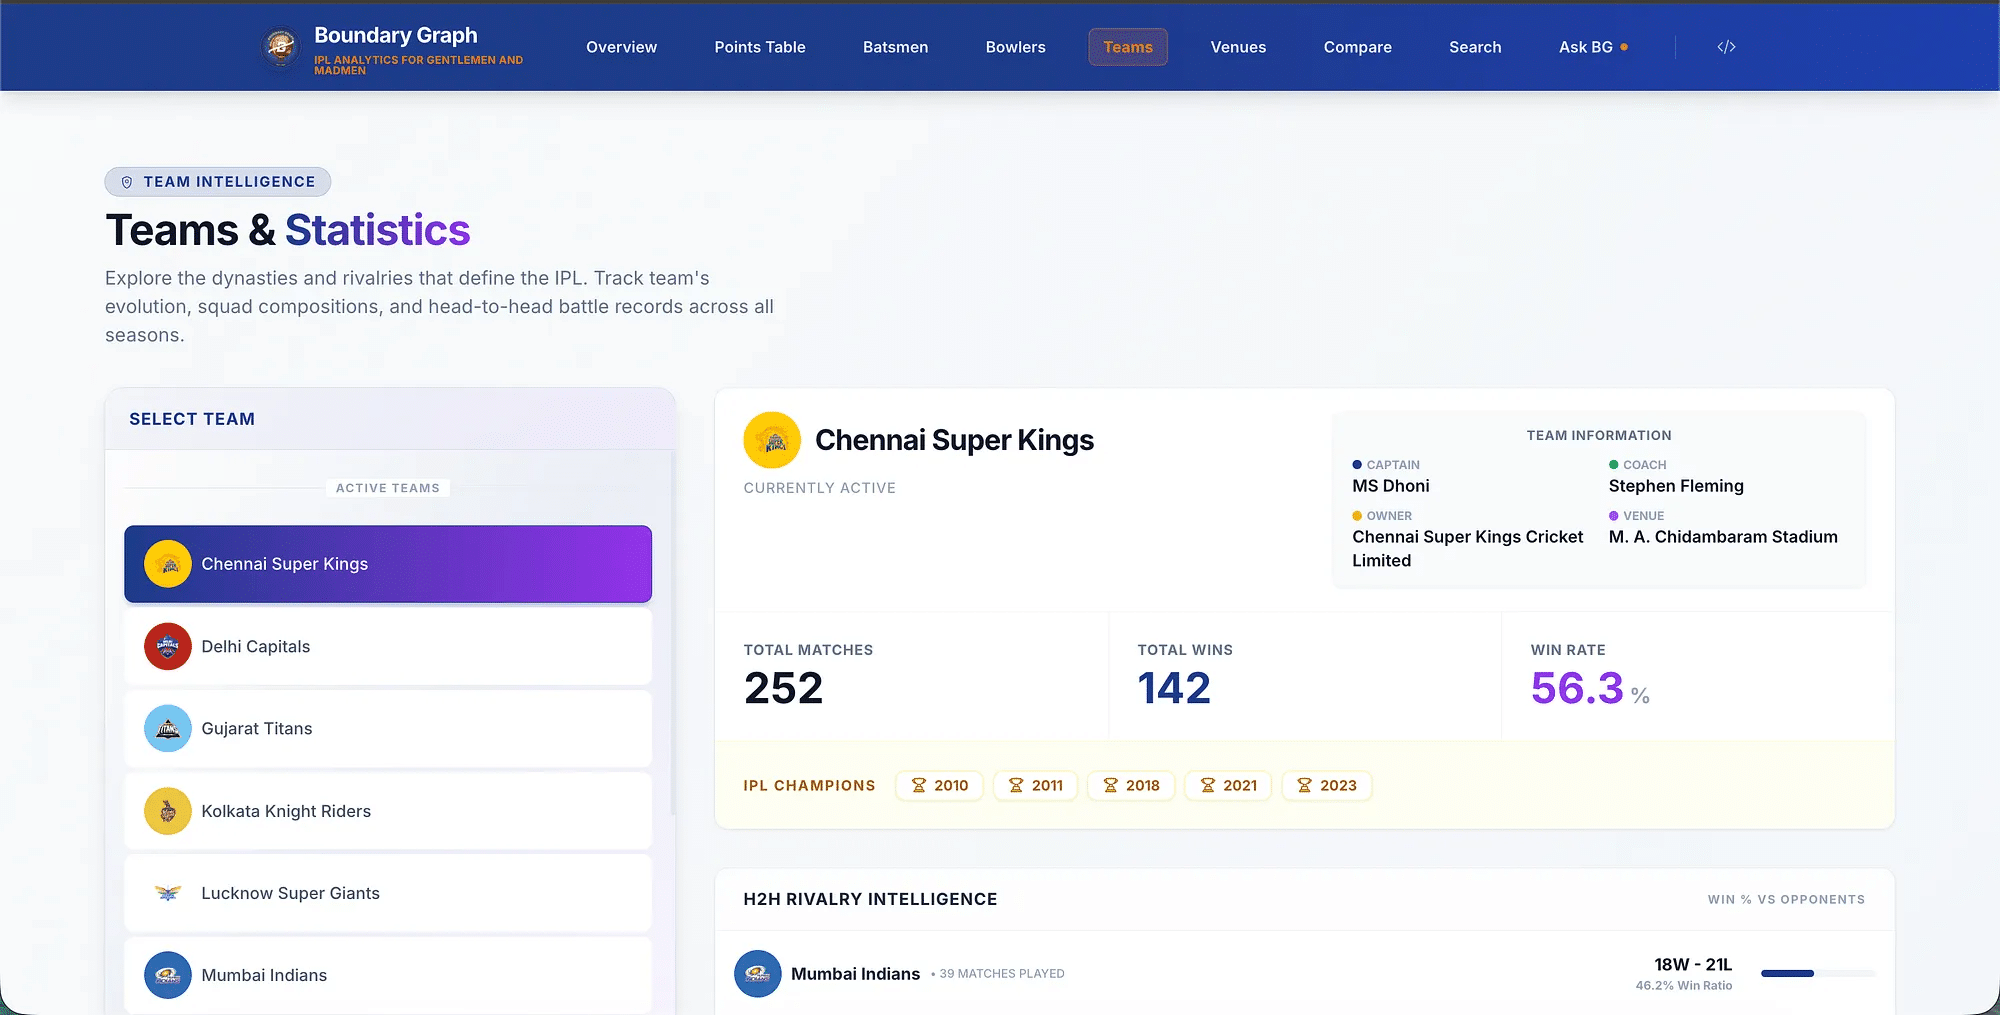
Explore the boundary graph
The complete graph model and interactive exploration experience are available through the Boundary Graph application at https://boundary-graph.netlify.app/. The app allows readers to navigate players, teams, venues, and seasons through relationship-driven queries and visualisations, offering a deeper and more intuitive understanding of the IPL beyond tables and aggregates.
Beyond the boundary rope
Although the IPL provides a familiar and engaging dataset, the modelling principles demonstrated here extend far beyond sports analytics. Any domain where outcomes depend on interactions rather than isolated attributes benefits from graph-first thinking.
Common examples include:
- Recommendation engines built on user item interaction paths
- Fraud detection systems analysing transactional networks
- Knowledge graphs capturing evolving semantic relationships
The IPL serves as a compelling illustration of how graph models scale from theory to production.
| Note: If you need more details and are unaware about the IPL cricket tournament, do visit the official website at https://www.iplt20.com/. |


