


Open source tools like MLflow help teams maintain a disciplined ML lifecycle without relying on fully managed platforms.
In every real-world machine learning project, the experiments multiply before you realise it. You tweak hyperparameters, change datasets, try different models — and suddenly you’re juggling dozens of runs.
Soon the questions start creeping in:
- Which model did we ship last month?
- What parameters gave the best accuracy?
- Why is the production model behaving differently from our training version?
This chaos isn’t a ‘data science problem’. It’s an ‘experiment management problem’, and MLflow solves exactly that.
MLflow provides a simple, open source way to track experiments, compare results, version models, and automate the path from training to deployment. With one tool, teams get transparency, reproducibility, and governance across the entire machine learning (ML) lifecycle.
What MLflow is — and the problem it solves
MLflow is not a model training framework. It is the glue around your ML workflow.
It provides four core components:
- Tracking: Logs parameters, metrics, artifacts
- Projects: Package code in a reproducible format
- Models: Standardise the way you store and serve models
- Model Registry: Central hub for versioning and promoting models
MLflow’s architecture is shown in Figure 1.
(Source: https://github.com/amitgoswami1027/ProductionalizeMachineLearningModels-Master)
Setting up MLflow
MLflow can be used:
- Locally (simple experiment tracking)
- On-prem (custom ML platforms)
- On cloud environments (Databricks, AWS, Azure ML, Kubernetes)
A typical ML project looks like this:
project/

├─ data/

├─ notebooks/

├─ models/

├─ mlruns/ ← MLflow stores your experiment logs here

└─ train.py
MLflow automatically records each experiment run; no manual book-keeping is needed.
Tracking experiments – the heart of MLflow
Experiment tracking is where MLflow shines.
When you train a model, MLflow logs:
- Parameters (learning rate, depth, seed, etc)
- Metrics (accuracy, RMSE, ROC-AUC)
- Artifacts (plots, model files, configs)
- Environment (Python version, library versions)
- Code snapshot (if enabled)
This helps teams answer questions like:
- Why did Experiment #7 outperform Experiment #4?
- What version of the dataset was used?
- Which model is safe to promote to staging?
Instead of writing everything to a spreadsheet or guessing from memory, MLflow stores it and visualises it automatically.
Visualising and comparing runs
This is the feature that makes MLflow indispensable.
Teams can:
- Sort runs by accuracy or loss
- Compare hyperparameter combinations
- See learning curves
- Dive deep into each run’s metadata
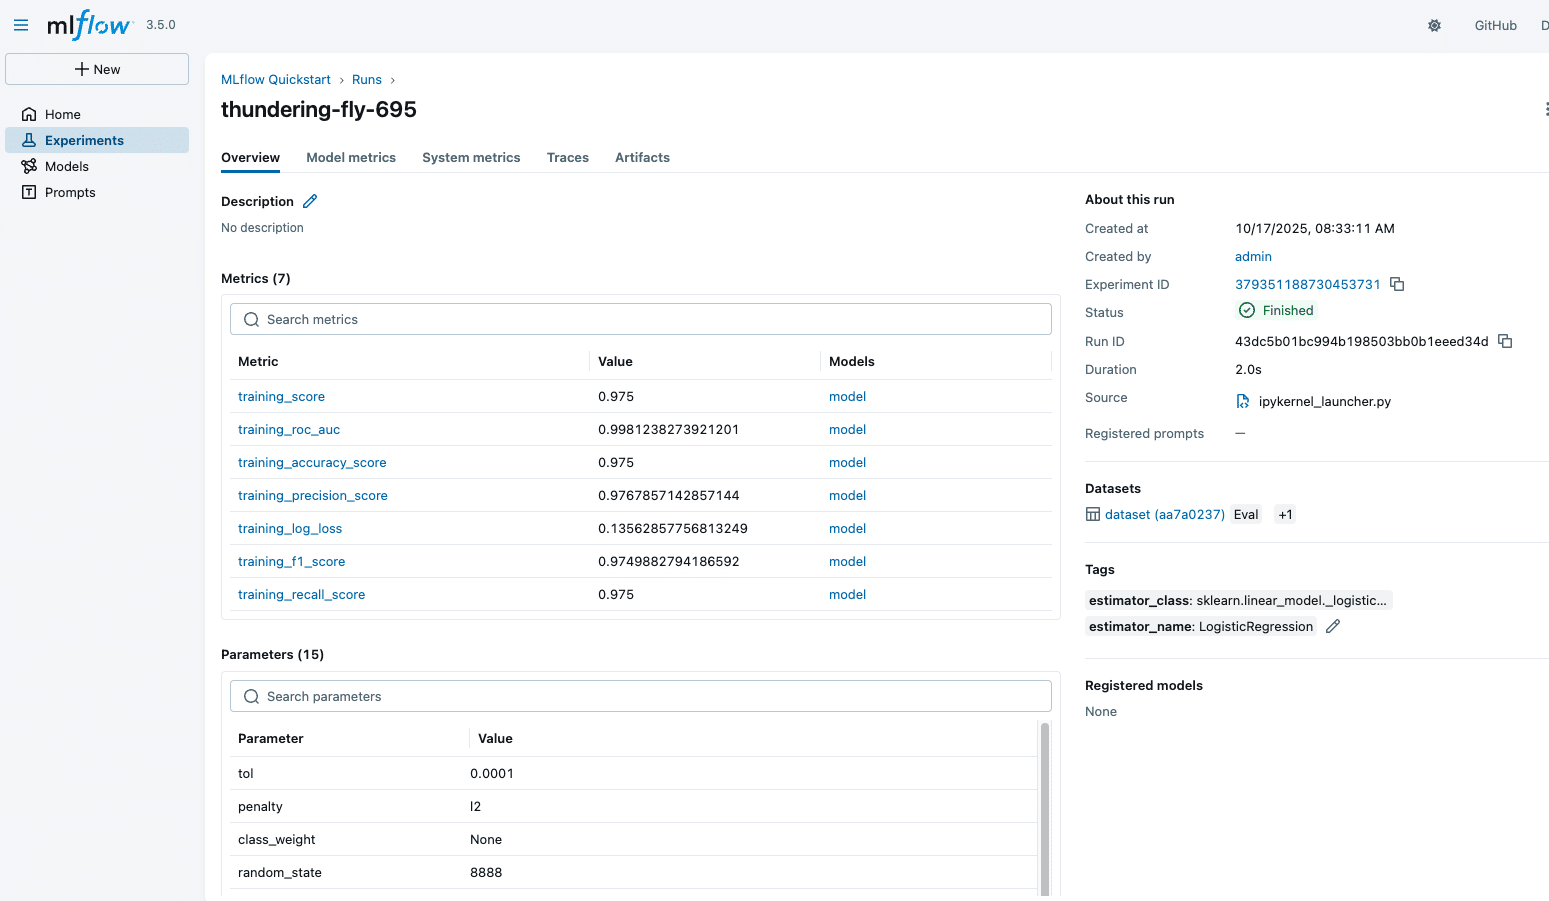
A sample MLflow experiment run is shown in Figure 2.
Model Registry: The control centre for versioning
MLflow’s Model Registry turns experiment results into production assets.
You can:
- Register a model
- Assign stages: Staging, Production, Archived
- Add comments and approval notes
- Track which version is currently in production
This prevents the classic mistake: Shipping the wrong model to production. It also allows multiple teams to collaborate without stepping on each other.
CI/CD integration: Automating the ML lifecycle
MLflow fits naturally into DevOps pipelines. Using GitHub Actions, Azure Pipelines, Jenkins, or GitLab CI, you can automate:
- Training
- Logging
- Registering new models
- Promoting models based on metrics
- Triggering deployments
A small workflow might look like:
Commit → Train → Log → Compare
→ Register → Deploy
Automation ensures:
- No silent model drifts
- Consistent experiment tracking
- Faster iteration loops
- Traceability across ML releases
Deploying MLflow models
MLflow models are packaged in a consistent format. You can deploy them using:
- MLflow’s built-in REST API
- FastAPI / Flask wrappers
- Docker containers
- AWS Sagemaker
- Azure ML
- Kubernetes (KFServing, Seldon Core)
Once deployed, models can be monitored for:
- Latency
- Throughput
- Accuracy decay
- Drift in input data
MLflow works nicely with monitoring tools like Prometheus and Grafana, enabling observability.
Best practices for teams
- Version your dataset
- Log everything (model metrics, configs, environment)
- Use Model Registry for all deployments
- Combine MLflow with CI/CD
- Introduce drift-detection monitoring
- Keep runs clean with tags and experiment names
MLflow has emerged as a foundational open source tool in the MLOps ecosystem. It brings order to experimentation, simplifies model versioning, and accelerates deployment cycles.
Whether you’re training simple ML models or large LLM-based systems, MLflow provides a unified, transparent, and reproducible workflow, which is exactly what modern data teams need.


