


In the first article in this series in the March 2025 issue of Open Source For You, we explored Monitoror and Vigil, two excellent open source tools to help set up status pages for black box monitoring of IT infrastructure. We explore another open source tool, statping-ng, in the second and final part of the series on black box monitoring.
Modern IT monitoring solutions are devised to make businesses proactive rather than reactive to service failures that can hurt them. Having an internal and/or external status page, which gives a quick overview to figure out what’s failing where in a cloud environment, is a must-have tool for any modern IT team to avoid service failures. We explored two open source tools, Monitoror and Vigil, in the first article in this series carried in the March 2025 issue of OSFY.
Statping-ng
Last but not the least, here’s a black box monitoring status page solution known as statping-ng that comes with many exciting features. Let’s directly jump into running it to explore the vast array of functionalities it provides. Create statpingng_stack.yml in your current directory as shown below.
statpingng_stack.yml
services:

statping:
container_name: statpingng
image: adamboutcher/statping-ng:${SPNGTAG:-latest}
ports:
- 58080:8080
restart: unless-stopped
networks:
default:
name: statuspage-demo
external: true
Now execute the following command in the current directory to launch the statping-ng Docker container:
docker run -it --rm -v /var/run/docker.sock:/var/run/docker.sock:ro -v ./statpingng_stack.yml:/etc/compose/statpingng_stack.yml:ro docker docker -f /etc/compose/statpingng_stack.yml up -d
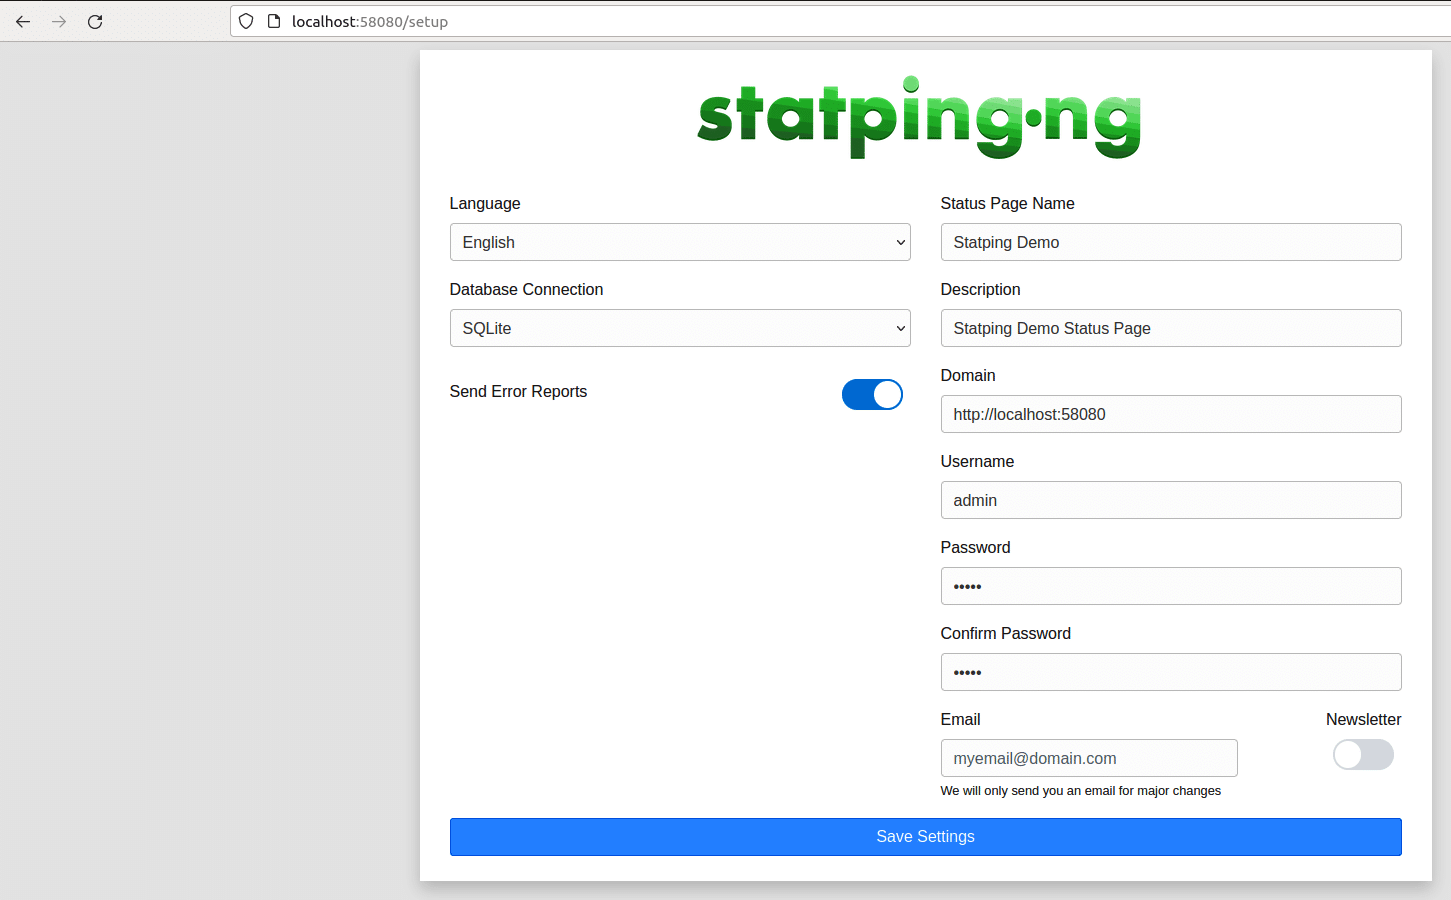
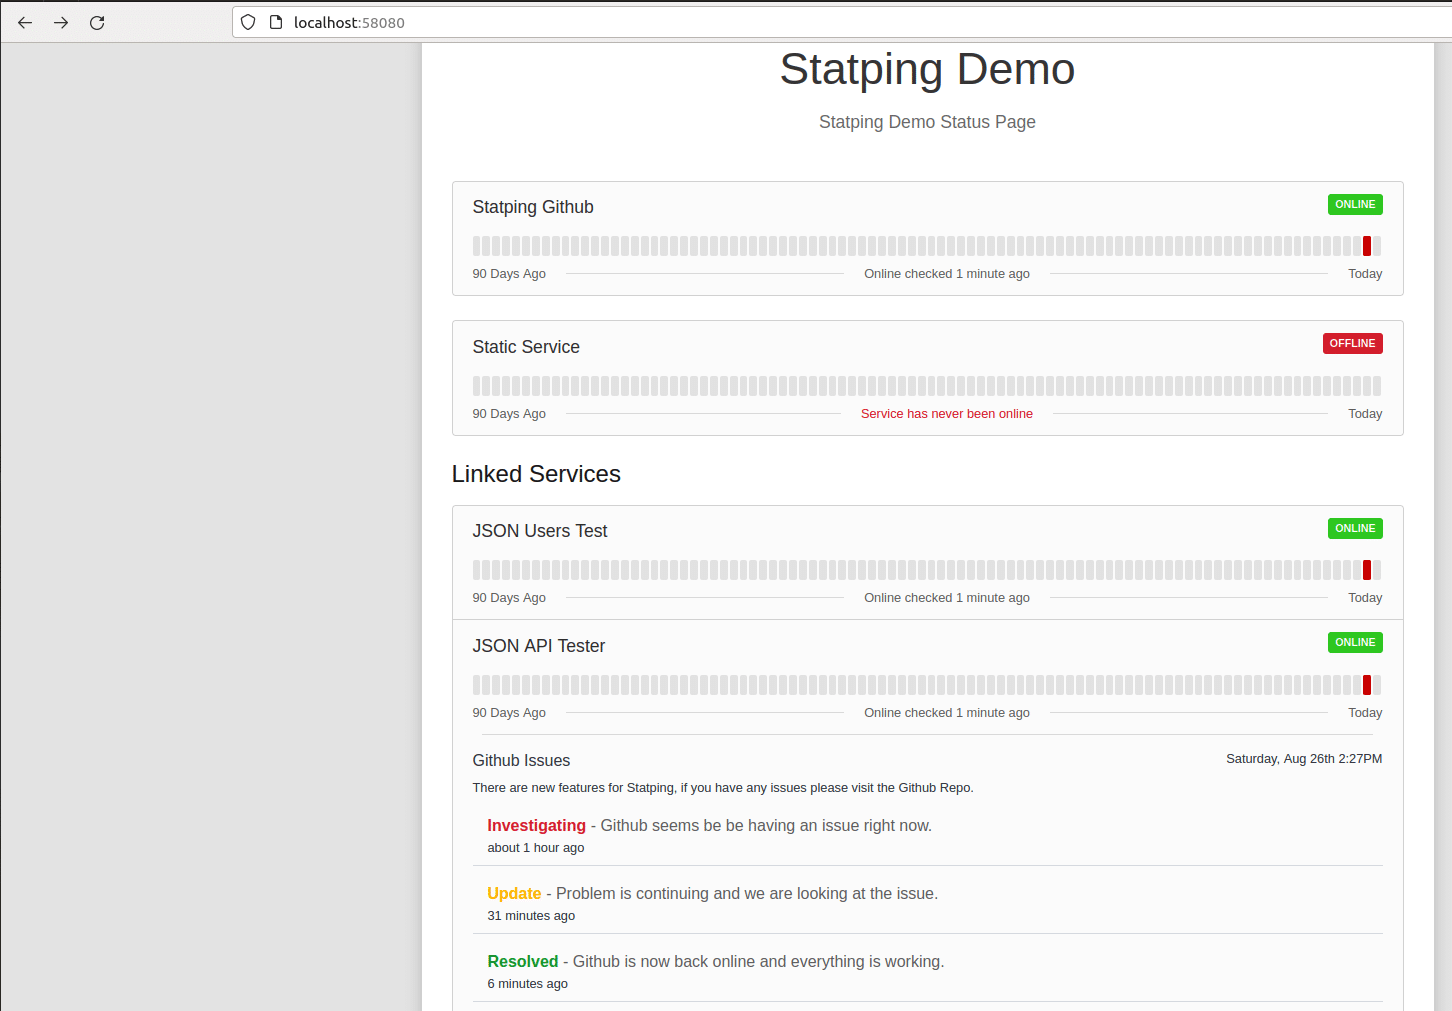
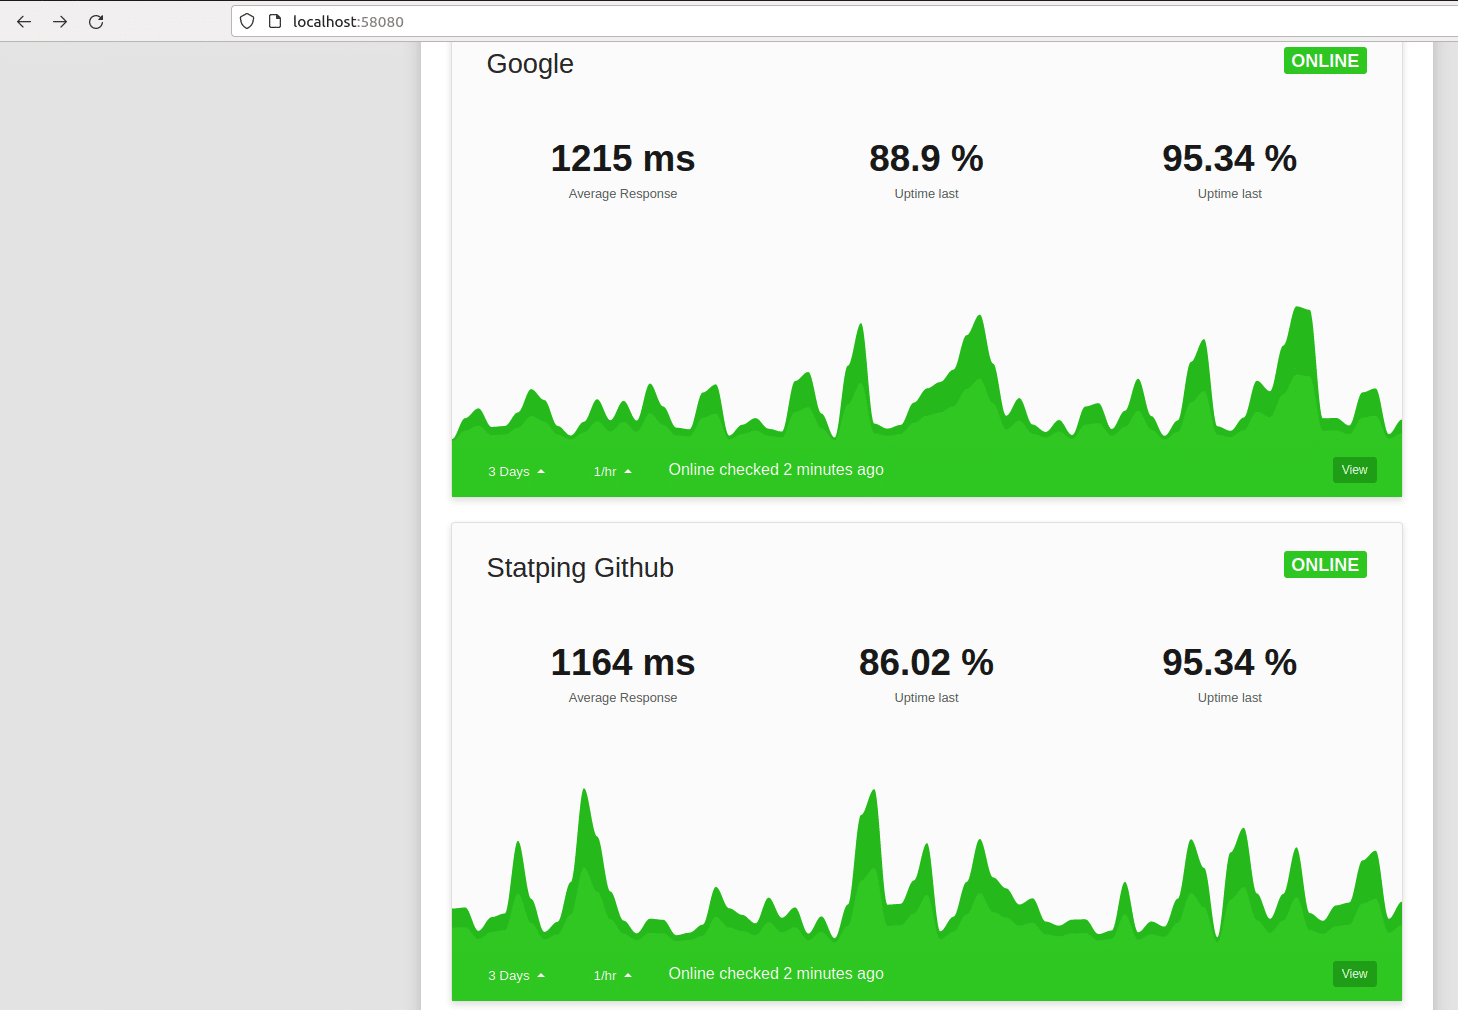
Accessing the localhost:58080 in your web browser should present you with the statping-ng setup page shown in Figure 1. Just fill the necessary details about status page Name/Description, Admin Username/Password, etc, and hit Save Settings. It should now proceed to another page with your entered Name/Description, which is already populated with multiple kinds of demo probes supported by statping-ng. Isn’t it cool that this crisp-looking status page not only provides the demo probes for you to get familiar with right away, but on scrolling down you’ll find monitoring graphs for these demo services as well? This is just the tip of the iceberg, and you can access the finer details about the monitored endpoint by clicking on the View buttons located on the respective graphs.
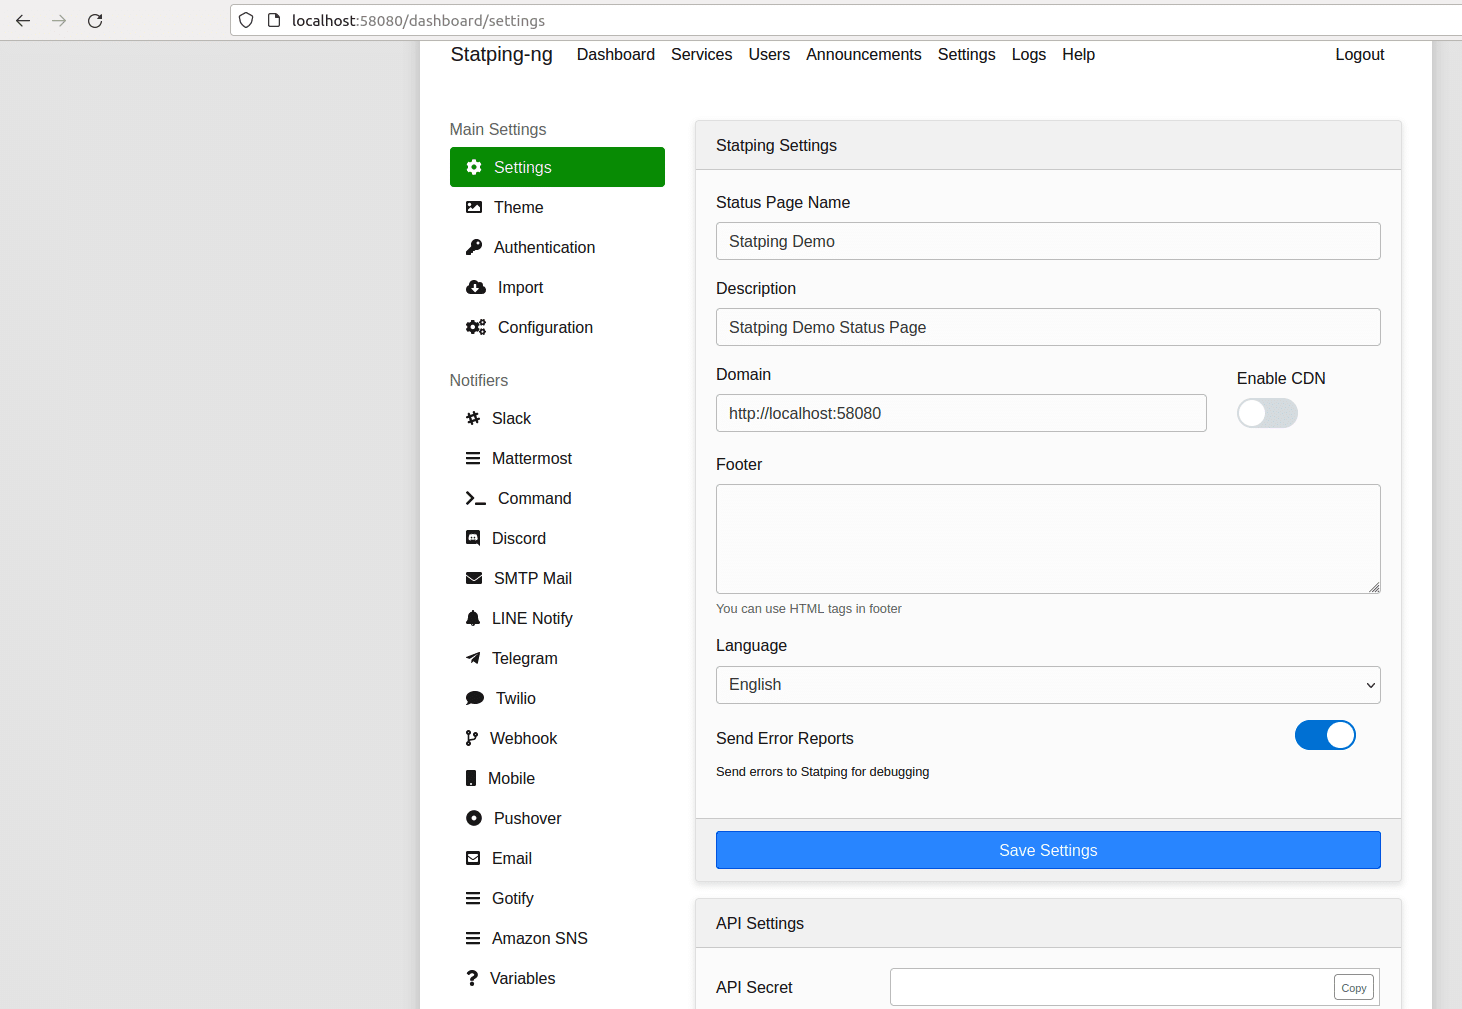
You’ll find a Dashboard link at the bottom of the status page, which takes you to another page (after entering the admin credentials already set by you in the statping-ng setup page) presenting every possible setting provided for the statping-ng configuration. Go to the Services tab to see and modify the demo services shown on the page. You don’t need to learn anything else to make use of statping-ng as everything is driven by its highly user-friendly tab pages for different operations. Just go to its Services tab and try adding/removing some of the probes by selecting the appropriate drop-down items for HTTP/TCP/UDP/gRPC/Static services, ICMP Ping, and setting various other applicable values. You could also set up various notifiers to receive various online/offline alerts, post various announcements for respective services, browse through the statping-ng logs, add different kinds of users, etc.
An important feature of statping-ng is the ability to backup and restore current statping services, groups, notifiers, and other settings to and from a JSON file, respectively. The statping-ng wiki provides more detailed information about its various aspects to get the most out of this tool.
Finally, let’s shift gears to start and configure the statping-ng programmatically through its configuration settings only, without any manual steps involved.
Dockerfile_MyStatpingNG is shown below. You can create a new Docker image using the command docker build -f Dockerfile_MyStatpingNG . -t mystatpingng. Now modify the statpingng_stack.yml as per the diff shown below to include the servers that statping-ng should monitor. Next, create the required bind mount directory for statping-ng using the command mkdir config and integrate the services.yml file shown below into the config directory. Finally, set up the correct owner for the bind mount directory with the command chown -R root:root config and bring up new statping-ng containers with the command used earlier.
Dockerfile_MyStatpingNG
FROM adamboutcher/statping-ng
CMD statping --port $PORT -c /app/config.yml
diff statpingng_stack.yml
5c5
< image: adamboutcher/statping-ng:${SPNGTAG:-latest}
---
> image: mystatpingng:${SPNGTAG:-latest}
7a8,41
> volumes:
> - ./config:/app
> environment:
> - “DB_CONN=sqlite”
> - “STATPING_DIR=/app”
> - “SAMPLE_DATA=false”
> - “GO_ENV=test”
> - “NAME=StatpingNG Probes Demo”
> - “DESCRIPTION=StatpingNG Probes Configuration Demo”
> restart: unless-stopped
>
> opensearch:
> image: opensearchproject/opensearch:${OSRHTAG:-latest}
> environment:
> - “discovery.type=single-node”
> restart: unless-stopped
>
> kafka:
> image: apache/kafka-native
> environment:
> KAFKA_LISTENERS: CONTROLLER://localhost:9091,HOST://0.0.0.0:9092,DOCKER://0.0.0.0:9093
> KAFKA_ADVERTISED_LISTENERS: HOST://localhost:9092,DOCKER://kafka:9093
> KAFKA_LISTENER_SECURITY_PROTOCOL_MAP: CONTROLLER:PLAINTEXT,DOCKER:PLAINTEXT,HOST:PLAINTEXT
> KAFKA_NODE_ID: 1
> KAFKA_PROCESS_ROLES: broker,controller
> KAFKA_CONTROLLER_LISTENER_NAMES: CONTROLLER
> KAFKA_CONTROLLER_QUORUM_VOTERS: 1@localhost:9091
> KAFKA_INTER_BROKER_LISTENER_NAME: DOCKER
> KAFKA_OFFSETS_TOPIC_REPLICATION_FACTOR: 1
> restart: unless-stopped
>
> redis:
> image: redis:${RDSSTAG:-latest}
> command: “redis-server --save 60 1 --loglevel warning”
Finally, run the command mkdir config and create the services config file shown below at that location.
services.yml

x-tcpservice: &tcpservice

type: tcp

check_interval: 60

timeout: 15

allow_notifications: true

notify_after: 0

notify_all_changes: true

public: true

redirect: true

x-httpservice: &httpservice

type: http

method: GET

check_interval: 45

timeout: 10

expected_status: 200

allow_notifications: true

notify_after: 2

notify_all_changes: true

public: true

redirect: true


x-icmping: &icmping

type: icmp

check_interval: 60

timeout: 15

allow_notifications: true

notify_after: 0

notify_all_changes: true

public: true

services:

x-tcpservice: &tcpservice

type: tcp

check_interval: 60x-tcpservice: &tcpservice

type: tcp

check_interval: 60

timeout: 15

allow_notifications: true

notify_after: 0

notify_all_changes: true

public: true

redirect: true

x-httpservice: &httpservice

type: http

method: GET

check_interval: 45

timeout: 10

expected_status: 200

allow_notifications: true

notify_after: 2

notify_all_changes: true

public: true

redirect: true

x-icmping: &icmping

type: icmp

check_interval: 60

timeout: 15

allow_notifications: true

notify_after: 0

notify_all_changes: true

public: true

timeout: 15

allow_notifications: true

notify_after: 0

notify_all_changes: true

public: true

redirect: true

x-tcpservice: &tcpservice

type: tcp

check_interval: 60

timeout: 15

allow_notifications: true

notify_after: 0

notify_all_changes: true

public: true

redirect: true

x-httpservice: &httpservice

type: http

method: GET

check_interval: 45

timeout: 10

expected_status: 200

allow_notifications: true

notify_after: 2

notify_all_changes: true

public: true

redirect: true

x-icmping: &icmping

type: icmp

check_interval: 60

timeout: 15

allow_notifications: true

notify_after: 0

notify_all_changes: true

public: true

services:

x-tcpservice: &tcpservice

type: tcp

check_interval: 60

timeout: 15

allow_notifications: true

notify_after: 0

notify_all_changes: true

public: true

redirect: true

x-tcpservice: &tcpservice

type: tcp

check_interval: 60

timeout: 15

allow_notifications: true

notify_after: 0

notify_all_changes: true

public: true

redirect: true

x-httpservice: &httpservice

type: http

method: GET

check_interval: 45

timeout: 10

expected_status: 200

allow_notifications: true

notify_after: 2

notify_all_changes: true

public: true

redirect: true

x-icmping: &icmping

type: icmp

x-httpservice: &httpservice

type: http

method: GET

check_interval: 45

timeout: 10

expected_status: 200

allow_notifications: true

notify_after: 2

notify_all_changes: true

public: true

redirect: true

x-icmping: &icmping

type: icmp

- name: ICMP Kafka

domain: kafka

<<: *icmping

- name: TCP Kafka 9092

domain: kafka

port: 9092

<<: *tcpservice

- name: ICMP opensearch

domain: opensearch

<<: *icmping

- name: TCP opensearch 9200

domain: opensearch

port: 9200

<<: *tcpservice

- name: TCP opensearch 9600

domain: opensearch

port: 9600

<<: *tcpservice

- name: HTTP opensearch

domain: https://admin:admin@opensearch:9200

<<: *httpservice

- name: ICMP redis

domain: redis

<<: *icmping

- name: TCP redis 6379

domain: redis

port: 6379

<<: *tcpservice
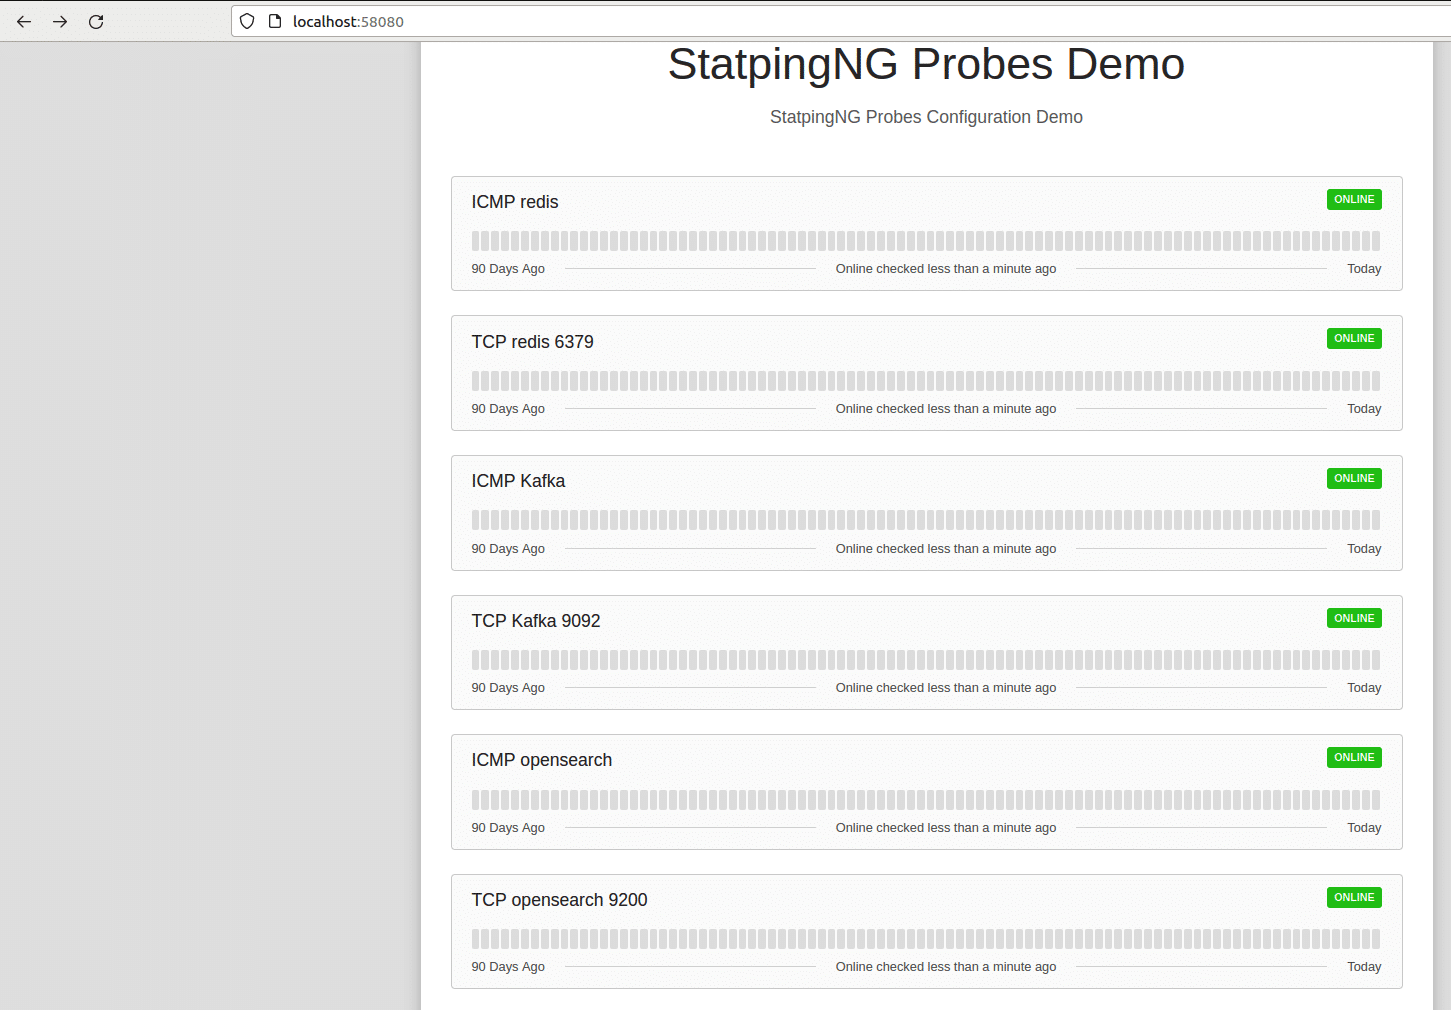
Now refresh the statping-ng Status page and you should see the new servers are being monitored as shown in Figure 5.
Status page black box monitoring is a logical first step when running modern complicated IT setups. Monitoror is a quick setup solution for a few servers/services and enables binary decision making of what and where things are failing. Vigil adds more functionalities over Monitoror to probe a large number of infrastructure endpoints. Statping-ng goes further and provides more user-friendliness and professional black box monitoring, giving tough competition to expensive enterprise solutions.


