














































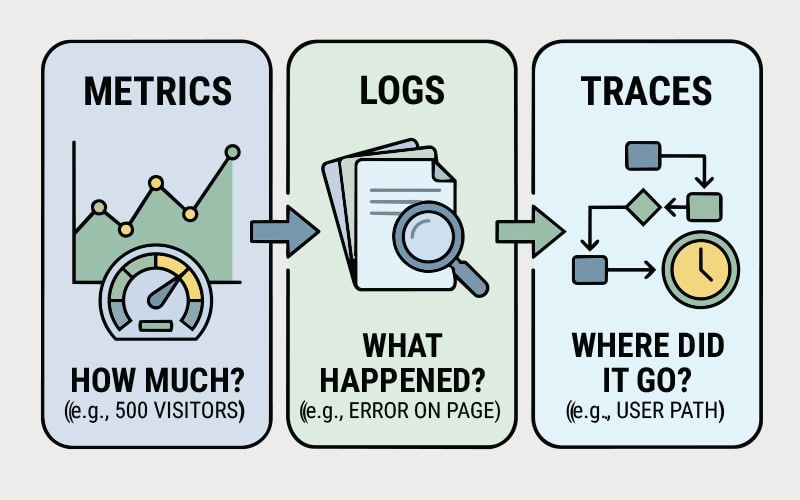

The three pillars of observability — metrics, logs and traces – help you find out what went wrong where and why in an AI-based system. You can’t do without them.
Three a.m. on a Tuesday and an error shows up. The platform engineer pulls up the logs. The SRE has been watching metrics for the last ten minutes. The developer wants to know why nobody has looked at the trace yet. All three are staring at the same outage from different perspectives.
Most writing on this topic does not help. The articles define spans by saying spans are units of work. They explain cardinality by talking about labels. The reader who came in already lost just stays lost.
Let’s try doing things differently by using analogies a non-engineer can follow.
- A log records one thing that happened with a timestamp and whatever extra detail the engineer who wrote that code felt like keeping.
- Metrics are numbers, sampled over and over, building up a chart you can look at.
- The trace is the whole journey of one request, start to finish, across every service it crossed.
Each pillar is built around a different question, and that is genuinely the whole separator.
The phrase ‘three pillars of observability’ (logs, metrics, traces) sounds polished, like a settled idea. But it’s just shorthand for: Here are three ways to record what is happening inside a running system. Different questions, different recordings. That is the whole insight.
What an event is (and why it matters)
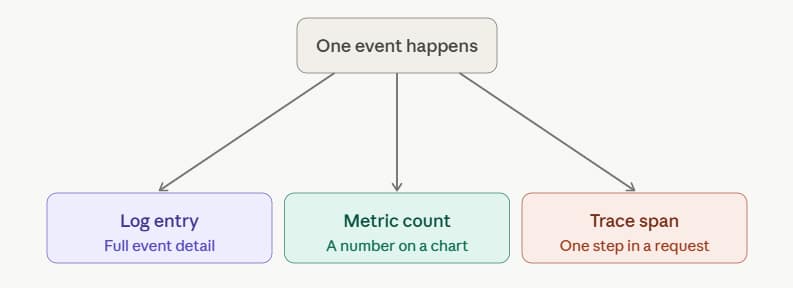
One word sits underneath all three pillars. An event is anything happening in a system that someone might care about later. Someone logs in. A request hits an endpoint. A query runs against a database. A pod crashes at 2:14 a.m. for reasons you will spend the next hour trying to figure out. A payment fails.
Logs, metrics, and traces are three different ways to record those events. Logs keep each one as their own entry. Metrics turn events into numbers (how many, how often, how fast). Traces gather up the events that belong to one request, no matter how many services that request touched, and present them as a single story. Three angles on the same underlying material.
What a log is
A log is a written entry for one specific thing that happened, with a timestamp and whatever extra context the engineer who wrote the code included. Think of a security camera with the time stamped on every clip. Rewind to any moment and see exactly what was on the screen.
127.0.0.1 alice [06/May/2024:11:26:42] GET /checkout 200 3477
Logs are painful to parse. Painful to search. Painful to do almost anything with once you have a few hundred million of them. Most teams now emit logs as structured JSON, which is the same event in a format a machine can handle:
{

“user”: “alice”,

“method”: “GET”,

“path”: “/checkout”,

“status”: 200,

“time”: “2024-05-06T11:26:42Z”

}
Logs come in different varieties depending on the job (error logs for things going wrong, audit logs for who-did-what-and-when, access logs for everything hitting the front door, debug logs that nobody enables in production until something is already on fire). The thread connecting them is depth. When something specific breaks at a specific moment, the log is where the why is hiding.
A quick comparison of the three pillars of observability
| Pillar | What it answers | What it looks like | Where it shines | Where it falls short |
| Logs | What happened at a specific moment | A timestamped record of one event | Deep detail for a single moment | Volume grows fast, storage gets expensive |
| Metrics | Is something off, and how widespread | A number measured repeatedly over time | Cheap, fast, easy to chart | Tells you what, not why |
| Traces | Where in a request did time go | A journey of one request across services | Pinpointing slow steps in distributed systems | Needs every service instrumented |
What a metric is
A metric is a number, sampled again and again. The car speedometer is the cleanest analogy. It is not recording every mile you ever drove. It shows you how fast you are going right now, and a chart afterwards can show you what your speed did across the whole drive.
Metrics in a real system look like:
- CPU sitting at 67 percent
- 12,400 requests per minute hitting the checkout service
- Error rate of 0.4 percent over the last five minutes
- Average response time around 240 milliseconds
The reason teams reach for metrics first is cost. Storing one number per minute is almost free. Querying months of those numbers is quick. You can glance at a chart and notice something shifted.
There is a popular short list called the ‘four golden signals’ (Google’s SRE book put it on the map and it stuck). The four are latency, traffic, errors, and saturation. Latency for how long requests take, traffic for how many are coming in, errors for how many are failing, and saturation for how full things are running. If these four look healthy, the service usually is. Not always. But usually.
What a trace is
A trace follows one request from end to end. The parcel-delivery analogy is the one I keep coming back to. A package gets a tracking number when it leaves the warehouse. Every scanner at every depot along the way records when it arrived and when it left. At the end of the trip, you pull up the tracking number and the entire journey shows up on one page, in order.
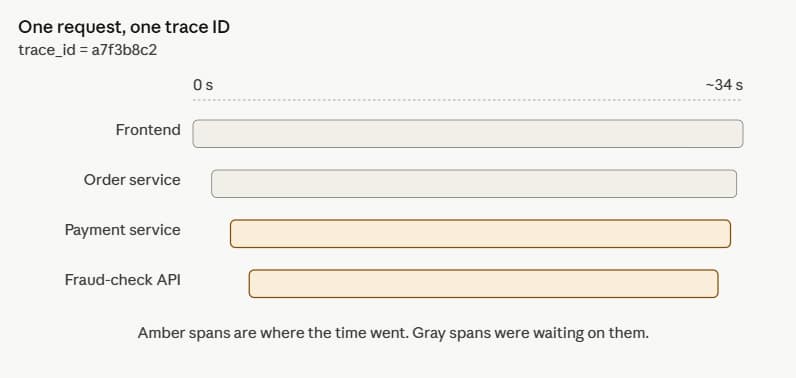
Each scan along the way is called a span. A span is one unit of work (a database query, a call to an external API, a cache lookup) with a start time, an end time, and some labels describing what was happening. All the spans for a single request share the same trace ID. That shared ID is what lets a tool stitch them back into one story.
Tracing only really started to matter once one request stopped being handled by one program. Take a single checkout click that touches a frontend, an order service, a payment service, an inventory service, and three databases. Eight stops in total. A metric will tell you that click was slow. Only the trace will tell you that 92 percent of the time was spent waiting on the inventory database while six other things ran in under ten milliseconds each.
You do not need to memorise the rows. The point is that each pillar is built around a different question. Aim a question at the wrong pillar and you get an answer that is worse than if you had not asked at all.
Where each one falls short
Logs get out of hand quickly. A busy service can throw off several gigabytes a day, most of which is noise (startup messages, healthy responses, the same handful of patterns repeating). Storing all of it gets expensive enough that retention windows become a quarterly argument inside engineering. What stays for ninety days? What gets dropped after seven? Whether that one team’s debug logs really need to live on hot storage?
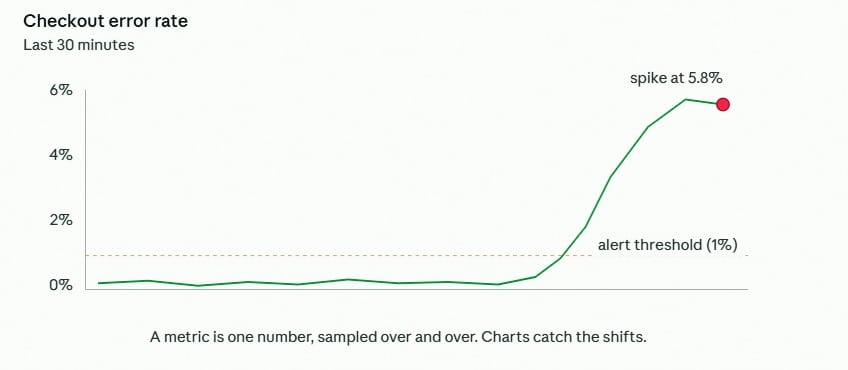
Metrics have a different problem. They are good at telling you something is wrong and useless at telling you why. An error-rate spike is easy to see on a chart. The chart will not tell you which user triggered it, which code path failed, or whether it was the new release from this morning. Averages cause their own trouble too. A response time of 200 milliseconds across all requests looks fine, until you find out one user in fifty is sitting through a four-second wait, and those are the users about to file a ticket.
Traces depend on every service in the chain doing its part. If one service skipped instrumentation, the trace breaks where that service handed off, and you cannot see where the time went. Traces also produce so much data that almost nobody keeps all of them. Most teams sample (one in every hundred requests, say, or only the failing ones), which means the exact trace you want is sometimes simply not in storage when you go looking.
What each one is actually for
Here is the part worth keeping in your head. The metric is what wakes you up. The trace tells you which corner of the system to look in. The logs are where the actual answer is hiding.
A short example to make that concrete. The on-call engineer’s phone goes off at 4:47 in the morning. The alert says the checkout error rate has climbed from 0.3 percent to 5.8 percent in the last seven minutes. That is the metric doing its job. It does not say what is broken, only that something is.
The engineer opens the trace view, filters down to the failing requests from the last fifteen minutes, and finds almost all of them are stuck in the payment service. Specifically, a span called verify_fraud_score is now averaging thirty-four seconds instead of 180 milliseconds. The trace has narrowed the whole incident down to one operation.
The last stop is the payment service logs from that window. The same line is repeating: timeout against an external fraud-check vendor’s API. The fraud vendor is having an outage. Nothing the team built is broken. They just have to roll over to the backup provider.
That whole investigation took about eight minutes. Pull any one of the three signals out and the chain stops working. Without the metric, the alert never fires. Without the trace, the team is grep-ing through a haystack of log lines hoping the right one floats up. It’s the log that points to the fix, but it is also useless without the other two doing their work first.
How the three work together
Engineers sometimes shorthand this as the ‘what, where, why’ pattern. A metric raises a flag (what is wrong), the trace narrows it down to a service or operation (where it is happening), and the log finishes the story (why). The order changes a little depending on the team and the type of incident, but the shape stays the same.
What nobody warns you about until it bites is that all three have to share context. If the log lines from the payment service and the trace that called the payment service have no thread connecting them, the engineer ends up running grep across a million log lines praying for the right one. The thread that holds these together is usually a trace ID stamped onto every log line emitted during that request, so one click on a slow span pulls up exactly the log entries it produced.
| Note: An open source project called OpenTelemetry is the standard most observability tools have agreed on for emitting and linking these signals, which means you do not end up stuck with the vendor. |
Where to start if you are new to this
Nobody sets up all three on the same day. The realistic order is metrics, then logs, then traces, with some real time between each.
Metrics are cheap, fast to put in place, and pay off the soonest. A handful of dashboards covering the four golden signals catches most of what an on-call team needs to know in the first six months. You will not yet have the answer to why. You will have the answer to when, which is the harder one to be without.
Logs are next, mostly because you already have some. Almost every system emits logs by default. The real work is not generating them — it is cleaning them up. Make them structured (JSON, not free text). Drop the ones nobody is ever going to search. Get the storage bill under control before somebody in finance starts asking questions.
Traces come last, and only when your system really needs them. If your application is one program running on one server, a trace will show you nothing a log was not already showing you. Tracing earns its place when a single request starts crossing service boundaries (two services, three, ten), and not before. Setting up tracing for a monolith is mostly busy work.
Closing the loop
Logs, metrics, and traces are not three competing tools fighting for your attention. They are three different questions you can ask of the same running system, and the real skill is knowing which question to ask first. Get that one call right and the rest of the investigation tends to unspool on its own.
Even with all three set up and linked to each other, observability still leans on someone in the room who knows where to look. The signals will show you everything. You can still miss it if nobody asks the right question. Tools do not replace judgment. They make judgment faster, which is not the same thing.
As systems keep splitting into more services running in more places (and that trend is not reversing), the gap between teams that read these signals fluently and those that only collect them is going to keep widening. The encouraging part is that the fluency is teachable. It usually starts by figuring out which question each signal was built to answer, and then trusting the signal to do its job.