




















































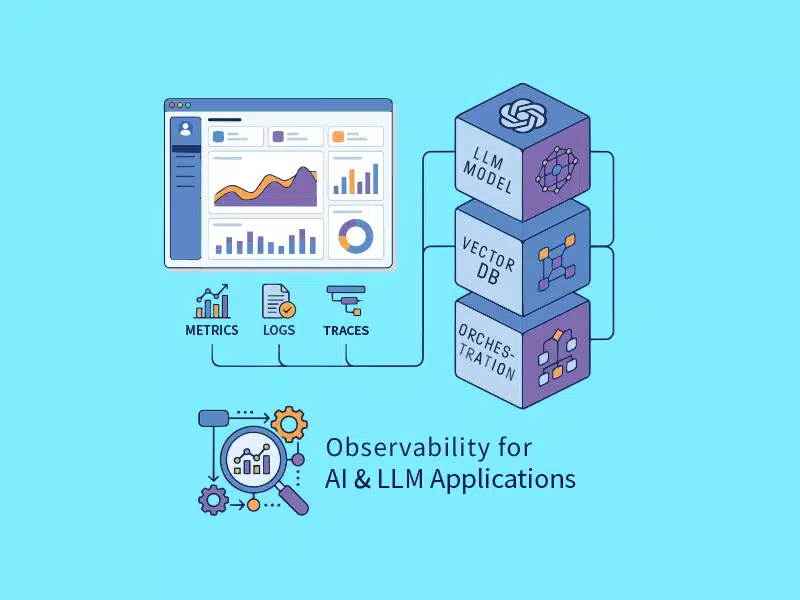

With the increasing adoption of AI, observability is emerging as a critical requirement for developing reliable, scalable, and production-ready AI systems.
The rapid adoption of generative AI has transformed the creation and operation of modern applications. In contrast to conventional software systems, LLM-powered apps can reason over vast amounts of data, produce human-like responses, and communicate with users in natural language. Consequently, companies can now automate complicated tasks that previously required human intervention. However, a variety of operational issues start to surface when businesses apply these solutions in production settings.
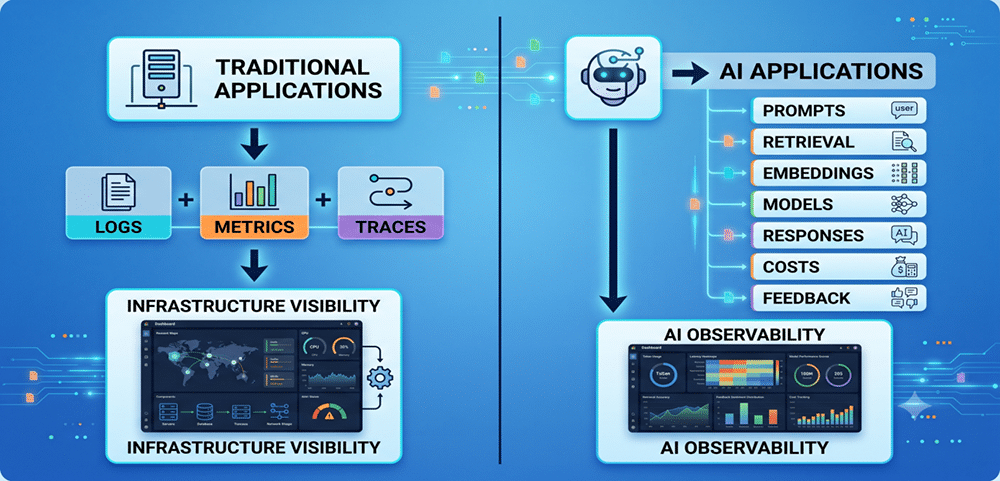
In traditional applications, monitoring typically looks at system availability, error rates, application performance, and infrastructure health. To ensure reliable performance, teams monitor metrics such as CPU utilisation, memory consumption, request latency, uptime of services, and more.
These markers are important even though they only provide a limited picture of AI systems.
From an infrastructure perspective, an LLM application may be fully operational while simultaneously producing incorrect responses, retrieving irrelevant data, producing inaccurate or misleading responses, or consuming excessive CPU power. In many instances, conventional monitoring approaches may demonstrate that the system is in excellent condition even when the end user experience is seriously affected.
This situation is unlike traditional software programs, which have deterministic outputs. LLMs have probabilistic outputs. The same question can have different answers depending on model parameters, retrieved context, prompt design, and the behaviour of the underlying model. Consequently, engineering teams must track infrastructure performance, model quality, response relevance, retrieval effectiveness, token usage, operational costs, and user satisfaction.
The complexity is further exacerbated by the increasing popularity of retrieval-augmented generation (RAG), AI agents, and multimodal AI systems. Many modern AI applications are made up of several connected pieces such as vector databases, embedding models, orchestration frameworks, prompt templates, external APIs, and foundation models. To identify performance bottlenecks or quality issues across these distributed components, you need a new approach to observability.
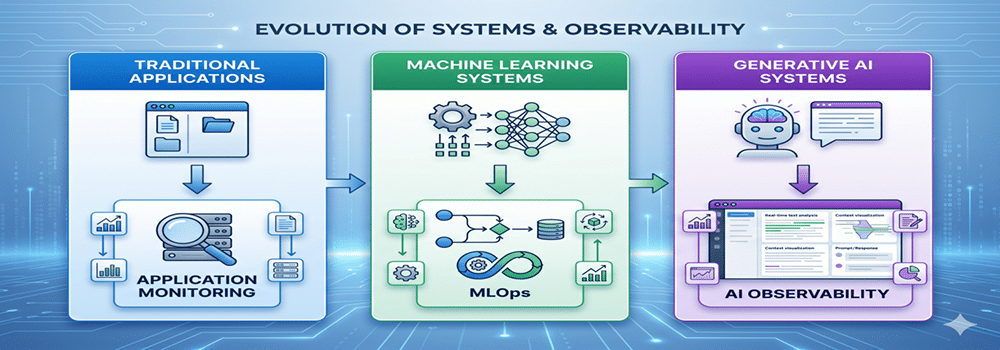
This is where AI observability becomes essential. AI observability extends beyond traditional monitoring and provides visibility into the full lifecycle of an AI request — from user prompt to model response. It enables teams to understand model performance, measure the quality of responses, find failures, monitor costs, and incrementally improve system performance.
Industry trends in AI operations
The last few years have seen a boom in generative AI. The adoption of large language models (LLMs) in customer support systems, enterprise search engines, software development tools, knowledge management solutions, and workflows for business process automation is accelerating.
The advent of RAG architectures has increased operational complexity. Organisations are now combining LLMs with enterprise documents, knowledge bases, and real-time data sources, rather than just model knowledge. This approach improves response accuracy but also introduces new failure modes in document retrieval, embedding quality, indexing, and context relevance.
Another major trend is the rapid increase in AI infrastructure spending. Monitoring inference cost, token consumption, and resource utilisation has become a business-critical requirement when enterprises deploy AI-powered applications at scale. Organisations need to be able to see how models are being used and if the operational costs are sustainable over time.
At the same time, user expectations are increasing. End users expect minimal latency from AI systems, but they also expect the answers to be accurate, relevant, and trustworthy. Even if the infrastructure components are working correctly, poor response quality, hallucinations, or retrieval failures can negatively impact user experience and business outcomes.
These evolving requirements are leading to the emergence of AI operations (AIOps) and AI observability practices. AI observability is emerging as a must-have capability for organisations deploying production-grade AI systems, akin to the way DevOps revolutionised software delivery and SRE improved application reliability.
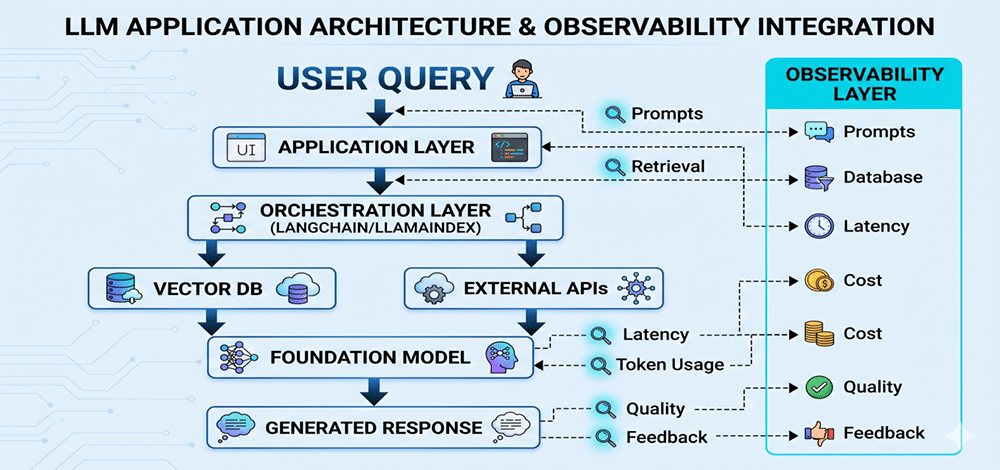
As a result, engineering teams are increasingly adopting observability platforms that provide visibility into prompts, retrieval workflows, model behaviour, response quality, latency, token consumption, and user feedback. This transition signals a new operational paradigm where monitoring expands from infrastructure to the behaviour and efficacy of AI systems themselves.
Why observability matters for AI workloads and LLM applications
The models themselves are becoming less important as organisations deploy more AI-powered systems in production environments. While model development often gets a lot of attention, the long-term success of an AI application depends on how well it can be monitored, maintained, and improved after deployment.
AI systems consist of multiple interconnected parts that collaborate to generate an answer, unlike conventional software applications. These can include foundation models, embedding services, vector databases, retrieval pipelines, orchestration frameworks, guardrails, and external APIs. A broken or degraded element directly affects the quality of the final output.
The importance of observability increases when AI applications start to serve real users.
For example, consider an enterprise knowledge assistant built on RAG. A user can ask a perfectly valid question, but the system may provide a wrong answer if the retrieval component did not locate the most relevant documents. In another case, the vector database could have higher latency, resulting in slower response times. From a traditional monitoring perspective, the application may seem to be healthy, but the user experience is severely impacted.
Another important factor is model quality. Large language models can sometimes produce responses that are incorrect, misleading, or not supported by the context. Hallucinations can erode user trust and create operational risks, especially in areas like healthcare, finance, legal services, and customer support. To identify such issues, observability mechanisms beyond standard infrastructure monitoring are required.
Cost control is another increasing concern. AI workloads require a lot of computing power, especially when dealing with a large number of requests. Monitoring token usage, model inference costs, GPU utilisation, and API consumption is an ongoing task to keep operational expenses in order.
And then there’s the performance consistency problem. User expectations for AI systems are extremely high. High inference latency or failure in external dependencies and delays in retrieval can affect the responsiveness of the application. In the absence of proper observability, finding the root cause of these issues can be a difficult and time-consuming process.
As AI systems become more sophisticated, observability extends beyond monitoring infrastructure metrics like CPU utilisation, memory consumption, and service uptime. Organisations also need to monitor prompt execution, retrieval effectiveness, response quality, token consumption, latency, operational costs, and user feedback.
Considering these points, running AI workloads is more than just deploying models. It is about running a complex distributed system that has to be reliable, transparent, performance-optimised, and continuously monitored through its lifecycle.
The observability pyramid for AI systems
Traditional application monitoring focuses on infrastructure and application health using metrics such as CPU, memory, network usage, latency, and error rates. However, AI applications introduce additional complexity, as healthy infrastructure does not guarantee high-quality AI responses.
Effective AI observability requires visibility across four layers. The foundation is infrastructure observability, which monitors CPUs, GPUs, memory, storage, and networks. Next is application observability, tracking throughput, latency, errors, retries, and service dependencies. The third layer, AI workload observability, measures inference latency, token usage, embeddings, vector database performance, retrieval quality, and model utilisation. At the top is AI quality observability, which evaluates hallucinations, response relevance, faithfulness, context quality, and user feedback. Together, these layers provide an end-to-end view of AI system performance, ensuring not only operational reliability but also high-quality user experiences.
Key signals to monitor in AI workloads and LLM applications
Once observability exists across the different layers of an AI system, the next challenge is to figure out which signals to observe. Unlike traditional applications, AI workloads generate operational and quality metrics that require simultaneous monitoring. By watching the right signals, engineering teams can spot performance bottlenecks, pinpoint quality issues, optimize costs, and enhance the user experience.
Infrastructure metrics
AI workloads at the infrastructure layer are usually much more resource-intensive than traditional applications. Training jobs, generating embeddings, vector searches, and model inference can be taxing on compute resources. Some important metrics for infrastructure are:
- CPU usage
- GPU usage
- Memory consumption
- Storage utilisation
- Network throughput
- Disk I/O performance
By tracking these metrics, teams can ensure they have enough resources and can spot infrastructure bottlenecks before they affect application performance.
Application performance metrics
Application-level metrics remain significant for AI-powered systems. These numbers give an idea of the overall health and responsiveness of the services. The key application metrics are:
- Request volume
- Requests per second (RPS)
- Average response time
- Error rates
- Service availability
- API success rates
These metrics are used to determine if users can reliably access the application and if supporting services are functioning correctly.
AI workload metrics
AI-specific workloads introduce a new class of observability signals that are not commonly found in traditional software systems. Some of the key metrics are:
- Inference latency
- Prompt processing time
- Embedding generation time
- Vector search latency
- Context size
- Model invocation frequency
- Throughput per model
These metrics give an idea about the efficiency of AI components and help to detect performance problems in the inference pipeline.
Token and cost statistics
Cost observability becomes even more critical as organisations scale AI deployments. For LLM apps, teams should constantly monitor:
- Input tokens
- Output tokens
- Total token consumption
- Cost per request
- Cost per user
- Daily and monthly inference costs
Tracking these metrics allows organisations to optimize prompt design, select the right models and manage operational costs.
Retrieval metrics for RAG systems
In RAG architectures, the quality of the response is directly affected by the quality of the retrieved information. This includes:
- Retrieval latency
- Top-k retrieval accuracy
- Context relevance
- Document freshness
- Vector database query performance
- Retrieval success rate
These indicators allow teams to determine if the retrieval layer is delivering relevant and useful context to the language model.
Quality and user experience measures
In many cases, the most useful signals concern the quality of the generated responses. Organisations should pay attention to:
- Response relevance
- Hallucination rate
- Faithfulness to source documents
- User satisfaction scores
- User feedback
- Resolution rate
- Task completion rate
These metrics provide insight into whether the AI system is generating meaningful business value and meeting user expectations.
Organisations can gain a holistic view of system health and performance by combining infrastructure, application, AI workload, cost, retrieval and quality metrics. This holistic approach is the foundation of effective AI observability.
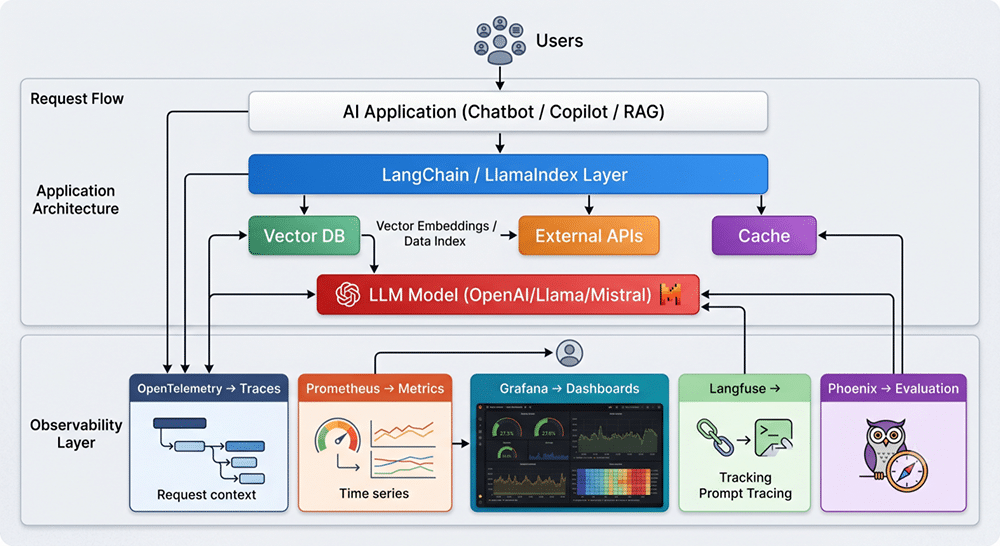
Reference architecture for AI observability
A production AI application typically consists of several interconnected components including orchestration frameworks, vector databases, language models, external APIs, and supporting infrastructure. Observability must therefore span the entire request lifecycle rather than focusing on a single component.
When a user submits a query, the request passes through the application layer and orchestration framework, where prompts are constructed and relevant context is retrieved. The retrieval layer may interact with vector databases, enterprise knowledge sources, or external services before sending the enriched prompt to the language model.
At each stage, telemetry data should be captured and analysed. OpenTelemetry can be used to generate distributed traces, allowing teams to follow requests across multiple services. Prometheus collects operational metrics such as latency, throughput, resource utilisation, and error rates, while Grafana provides dashboards and alerting capabilities.
AI-specific observability tools add another layer of visibility. Langfuse enables prompt tracing and response analysis, while Arize Phoenix helps evaluate retrieval effectiveness and response quality. Together, these tools provide end-to-end visibility into both system performance and AI behaviour.
By combining infrastructure monitoring, distributed tracing, and AI-specific evaluation, organisations can quickly identify bottlenecks, diagnose failures, optimise costs, and improve response quality across their AI workloads.
Example use case: Monitoring an enterprise RAG assistant
An enterprise knowledge assistant can help workers locate internal documents, policies, and technical guides. The assistant in our example is based on an RAG architecture, which enriches user queries with relevant information from a vector database before sending them to a large language model.
When a user submits a question, the request first goes through the orchestration layer. The system retrieves the most relevant documents from the knowledge base and constructs a prompt that consists of the user query and the context extracted from the retrieved documents. The language model generates a response and returns it to the user.
Meanwhile, observability tools are constantly collecting telemetry data. OpenTelemetry traces the request through the application components, and Prometheus collects metrics such as request volume, latency, and resource utilisation. Grafana dashboards offer real-time insight into system performance.
AI-specific observability platforms provide more profound insights. Langfuse logs prompts, retrieved context, model responses, and token usage. Arize Phoenix helps in evaluating the quality of retrieval and finding cases where the retrieved documents were not sufficient or not relevant. OpenLIT provides visibility into the latency of the model, the cost of the APIs, and the performance of the entire AI workload.
If response latency is increasing, retrieval quality is decreasing, or token consumption is unexpectedly spiking, engineering teams can quickly identify the root cause and take corrective action. This visibility helps keep the assistant reliable, cost-effective, and useful for end users.
Benefits of AI observability
There are many practical benefits of implementing observability across AI workloads and LLM applications for engineering teams and organisations.
Enhanced reliability
Teams can swiftly identify failures within retrieval pipelines, model interactions, and support services before they impact users.
Faster troubleshooting
End-to-end traces help engineers identify bottlenecks and troubleshoot issues faster.
Improved response quality
Monitoring retrieval effectiveness, hallucinations, and user feedback improves the accuracy and relevance of generated responses.
Cost optimization
Companies gain visibility into token usage, inference expenses, and resource utilisation, helping them manage operating costs.
Enhanced user experience
Tracking latency, response quality, and satisfaction metrics ensures consistent and reliable AI interactions.
Improved operational visibility
A single observability framework provides teams with a comprehensive view of infrastructure, applications, AI workloads, and model behaviour.
AI and LLM applications are rapidly becoming a foundational element in modern enterprise technology stacks. But operating these systems demands more than traditional infrastructure monitoring. AI workloads pose extra challenges and are often difficult to understand and troubleshoot with traditional methods of observability.
AI observability is therefore a critical discipline for organisations deploying production-grade AI solutions. By using infrastructure monitoring, distributed tracing, AI-specific data collection, and quality checks, teams can see everything happening in the entire AI process. Organisations that invest in observability today will be better placed to scale their AI initiatives successfully in the years to come.
Disclaimer: The views expressed in this article are those of the author and Gspann Technologies, Inc., does not subscribe to the substance, veracity or truthfulness of the said opinion.