

In order to troubleshoot computer network related problems effectively and efficiently, an in-depth understanding of TCP/IP is absolutely necessary, but along with that, you also need to see TCP/IP traffic. There are various open source and commercial tools available to capture and display network traffic for further analysis.
Let us consider the essential features of effective traffic analysis and network troubleshooting tools:
- The ability to capture traffic from various networks such as wired, wireless, etc
- Layer-wise representation of captured traffic for easy readability
- Ability to save the packets in standard format
- Ability to drill down packets for traffic analysis
All these features are an inherent part of Wireshark. Over and above this, the tool is available under GNU GPL (read, free). So Wireshark is an absolute must for any networking professional!
This series of articles on Wireshark will familiarise readers with the Wireshark GUI and analysing various TCP/IP protocols by means of captured packets, explaining the features of Wireshark and discuss various scenarios to locate network related problems.
The basics: Wireshark modules
To provide the desired functions, Wireshark uses a number of different modules integrated together by the Wireshark core.
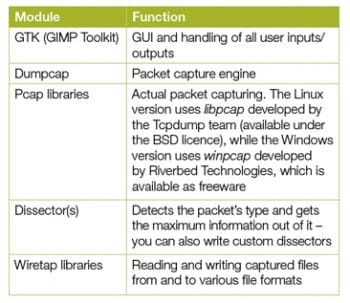
Here, I have taken the liberty of mentioning only the important or relevant modules and their functions for easy understanding. For more details, please refer to wireshark.org.
Installation
Wireshark installation is very simple and straightforward.
Windows: Download the latest 32- or 64-bit version installable, which is compatible with your Windows version; double-click on it and follow the instructions.
During this installation, you will be asked to confirm installation of winpcap libraries. Here is an interesting point to remember for those paranoid about security: some of the websites, such as McAfee SiteAdvisor, rate winpcap libraries as security risk. This is primarily due to the ability of winpcap to capture network packets. So go ahead and install the libraries, which are a must to run Wireshark.
Ubuntu: Search for Wireshark under Ubuntu Software Centre, and click to install or use the command line:
sudo apt-get install wireshark
Thats it. Your system is ready for the first capture. Welcome to the exciting world of network troubleshooting and protocol analysis.
Capturing packets
Windows: Start Wireshark by clicking its icon.
Linux: Use the command wireshark. You may require administrative privileges. The recommended way to do so is to use gksudo wireshark.
Wireshark also has various command line options, which will be covered in a separate article. Optionally, you can capture packets using dumpcap (the packet capture engine), save them and use Wireshark for further analysis. This ensures minimum administrative privileges, limited only to the capture engine and not the entire Wireshark software.
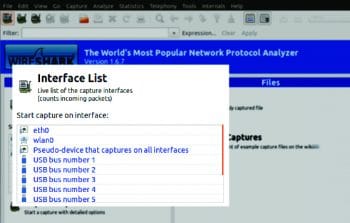
Select the capture interface on the first screen. Go through Figure 1; did you notice something interesting under the Interface List? You can capture traffic on USB ports as well!
Click on the desired interface and Wireshark starts capturing and displaying packets, which are represented in three panes.
The three Wireshark panes
The topmost pane is called the Packet List Pane and displays the captured packets number, its time stamps, source and destination addresses, protocol, length and other information about it.
The middle pane displays Packet details of the current packet as viewed from various layers. The captured data could be viewed as Frame Physical, Ethernet Data Link, IP Network, UDP (or TCP) Transport, and DNS (or any other application) Application layers. (For more details about these layers, there is ample material, including excellent videos, on the Web to get a better understanding.)
Packet Bytes are displayed in the bottom most pane.
If this sounds very simple, here is one interesting difficulty.
Capturing packets in a switched environment
Capturing traffic towards and from Wireshark PC is simple enough; however, for network troubleshooting you require to capture various kinds of network traffic, such as what originates from any of the systems in the network, the entire network traffic from your network towards the Internet, etc.
Capturing traffic in a switched environment is not easy. And heres why. Let me start with the difference between an Ethernet hub and an Ethernet switch. The hub sends all packets received on a particular port to all the other ports. The switch forwards traffic only to the designated port. To achieve this, the switch maintains a table of MAC addresses (Layer 2 address corresponding to the port binding), and forwards the packet to the interface to which the device with the destination MAC address is connected. If the destination MAC is not known, it broadcasts to all ports (except the sender port), asking for the port that has the device with the destination MAC. Once a confirmatory reply is received, the actual packet is forwarded to the corresponding port only.
From a security perspective, an Ethernet switch is definitely better (than the hub). However, the feature ensuring security poses a challenge while capturing network traffic. In a switched network, the default capture will contain packets to and from the Wireshark machine and broadcast traffic only.
There are several ways to overcome this:
1. Hubbing out: Replace the switch with a hub and capture traffic by connecting the Wireshark system to the hub.
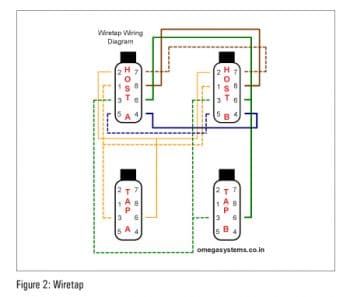
2. Using Wiretap: Atap is used to capture communication between two end points. The primary concern while inserting Wiretap is that it should not disturb any traffic between two hosts. Wiretap achieves this by sitting between two end points (the switch and device) and providing two Ethernet outputs. These are connected to the Wireshark computer system with dual Ethernet. This system captures all traffic between two nodes without disturbing existing traffic. If this tap is inserted between the firewall and the switch, it will capture all Internet traffic. Typically, this box can be constructed by wiring four information outlets. See the wiring diagram for more details (Figure2).
3. Using Switched Port ANalyzer (SPAN), also called port mirroring: SPAN ports are available with some of the managed switches. Once enabled, this feature copies traffic from the defined ports to the SPAN port. The Wireshark system is connected to this SPAN port to capture the traffic. The disadvantage of this system is that the SPAN port can get overloaded since it receives all traffic from many ports. This results in loss of packets.
4. Using ARP spoofing: This requires using the ARP spoofing tool such as ettercap-NG, which is tricky and may result in network disruption if sufficient care is not taken.
The first capture
Let us start by capturing packets for the DNS (Domain Name Service) protocol. As you must be aware, DNS resolves URLs to IP addresses. It is a very simple UDP protocol (works on TCP as well). It sends out a DNS query and gets a DNS query response.
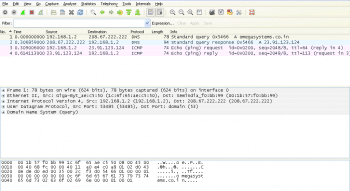
To capture DNS, start Wireshark and select the desired interface to start packet capture. Go to the command prompt under Windows (or the terminal, in the case of Linux) and ping any URLthe associated screenshot (Figure 3) is for omegasystems.co.in. You will see several captured packets on the screen. Stop packet capture.
The command line request to PING omegasystems.co.in triggered a 78-byte UDP DNS query from the computer system 192.168.1.2 (IP address in your capture will be the same as the TCP/IP configuration of your capture system) towards DNS server 208.67.222.222. A 94-byte reply was received with the IP address of omegasystems.co.in as 23.91.123.124.
A 74-byte ICMP Echo Request is now sent to the resolved IP address of omegasystems.co.in, for which a 74-byte ICMP Echo reply is received.
Please view the Time column, and you will notice that approximately 0.3 seconds were required to receive replies for both these queries.
A word of caution
The test scenarios described in this series of articles are capable of revealing sensitive information such as login names and passwords. Some scenarios, such as using ARP spoofing, will disturb the network temporarily. Make sure to use these techniques only in a test environment or avail explicit written permission before using them in a live environment.


