


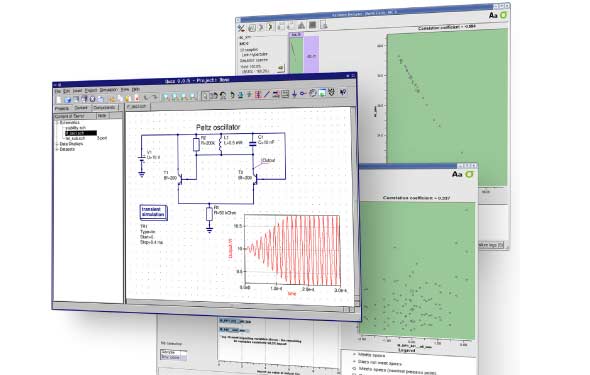
 Life can be a bit tough without all the electronic gadgets we have got used to. But making an electronic circuit work is even tougher. For electronics hobbyists, there is a lot that they must know before getting their hands dirty, such as circuit designing and debugging. If the design is wrong, most electronic components get damaged, resulting in a waste of money. Featured here is a circuit simulator that hobbyists can get started with.
The Quite Universal Circuit Simulator (QUCS) is an open source electronics circuit simulator software released under the GPL, and is still under development. Though it is very stable, there are things missing here and there, so let’s look at what it can and cannot do. The QUCS GUI is based on Qt by Trolltech. The software aims to support all kinds of circuit simulation types, e.g., DC, AC, S-parameter, harmonic balance analysis, noise analysis, etc. The outputs of these analyses can be expressed in various forms like the Smith-Chart, Cartesian, Tabular, Polar, Smith-Polar combination, 3D-Cartesian, Locus Curve, Timing Diagram and Truth Table.
Installing QUCS
On a Debian-based system, QUCS installation is as simple as sudo apt-get install qucs, while in Ubuntu QUCS is available in the Ubuntu Software Centre. Or you can do it the hard way, compiling from source. Download the tarball from http://qucs.sourceforge.net/download.html and unpack it with tar xvzf qucs-.tar.gz; then switch to the source directory (cd qucs-<version>) and configure the source package for your system with ./configure. Compile the package with make and install it with make install.
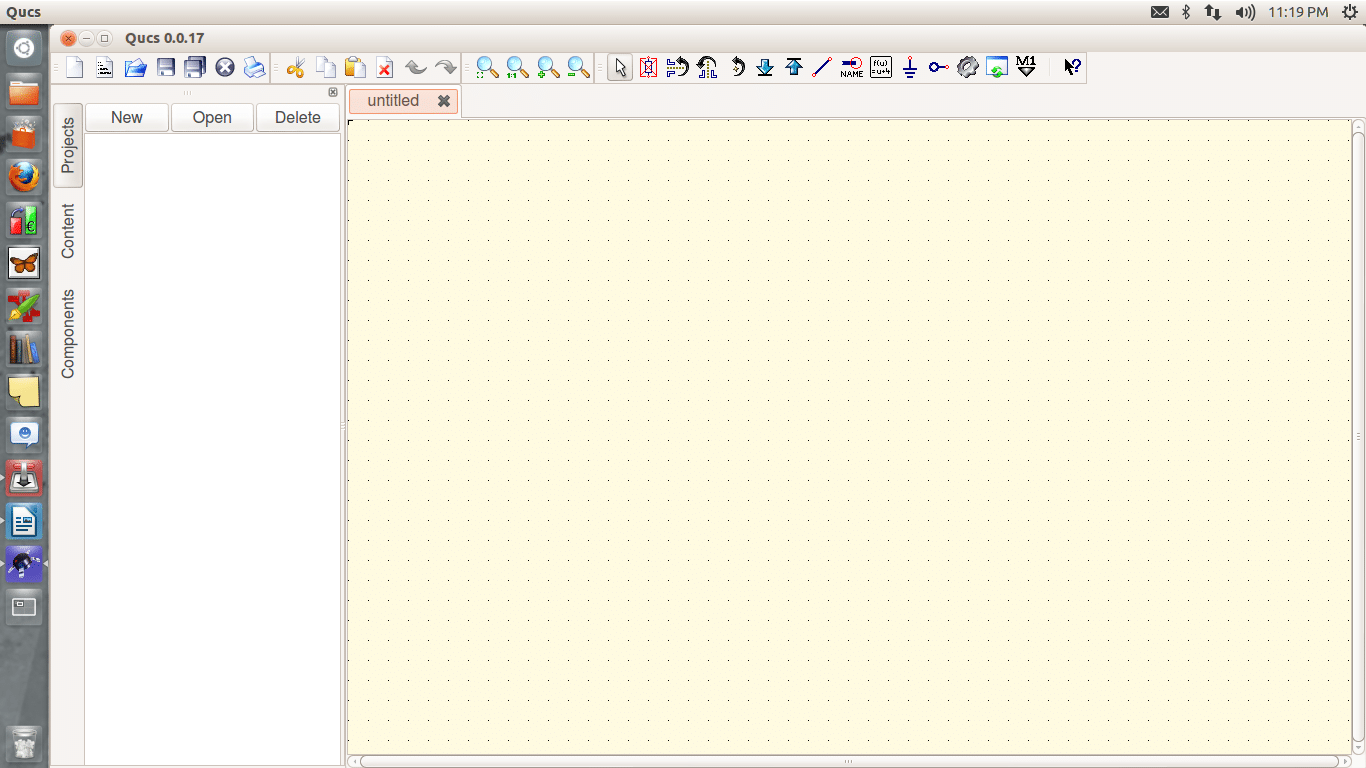
Once installed, run qucs in the terminal or launch it from the Unity dashboard.
The QUCS structure
QUCS is actually a collection of different modules, each with a different function:
- The GUI is used to create schematics, set up simulations, display simulation results, for writing VHDL code, etc.
- The analogue simulator is a command line program, which is run by the GUI in order to simulate the schematic you previously set up. It takes a netlist, checks it for errors, performs the required simulation actions, and finally produces a dataset.
- The text editor is used to display netlists and simulation logging information, and to edit files included by certain components (like SPICE netlists or Touchstone files).
- The filter synthesis application can be used to design various types of filters.
- The transmission line calculator can be used to design and analyse different types of transmission lines (like microstrips and coaxial cables).
- The component library manager holds models for real-life devices (like transistors, diodes, bridges and opamps). It can be extended by the user.
- The attenuator synthesis application can be used to design various types of passive attenuators.
- The command line conversion program tool is used by the GUI to import and export datasets, netlists and schematics from and to other CAD/EDA software. The supported file formats as well as usage information can be found in the qucsconv man page.
- Additionally, the GUI steers other EDA tools. For digital simulations (via VHDL), the program FreeHDL is used. For circuit optimisation (minimisation of a cost function), ASCO is configured and run.
The QUCS component library has almost all the components needed for most of the circuits, but as it is still in the development stages, some components might be missing. The following categories of components are provided:
- Lumped components (R, L, C, amplifier, phase shifter, etc)
- Sources
- Probes
- Transmission lines
- Non-linear components (diodes, transistors, etc)
- Digital components
- File containers (S-parameter datasets and SPICE netlists)
- Paintings
There is also a component library that includes various standard components available in the market (bridges, diodes, varistors, LEDs, JFETs, MOSFETs, and so on).
Working with QUCS
So let’s start off with some circuits. Launch QUCS and proceed to start a new project. Click the New button in the explorer window; a dialogue box will appear asking for the project name supply one, and proceed. Once the project is created, you can see all the contents of the project in the Explorer window. The workspace is where you draw your circuit.
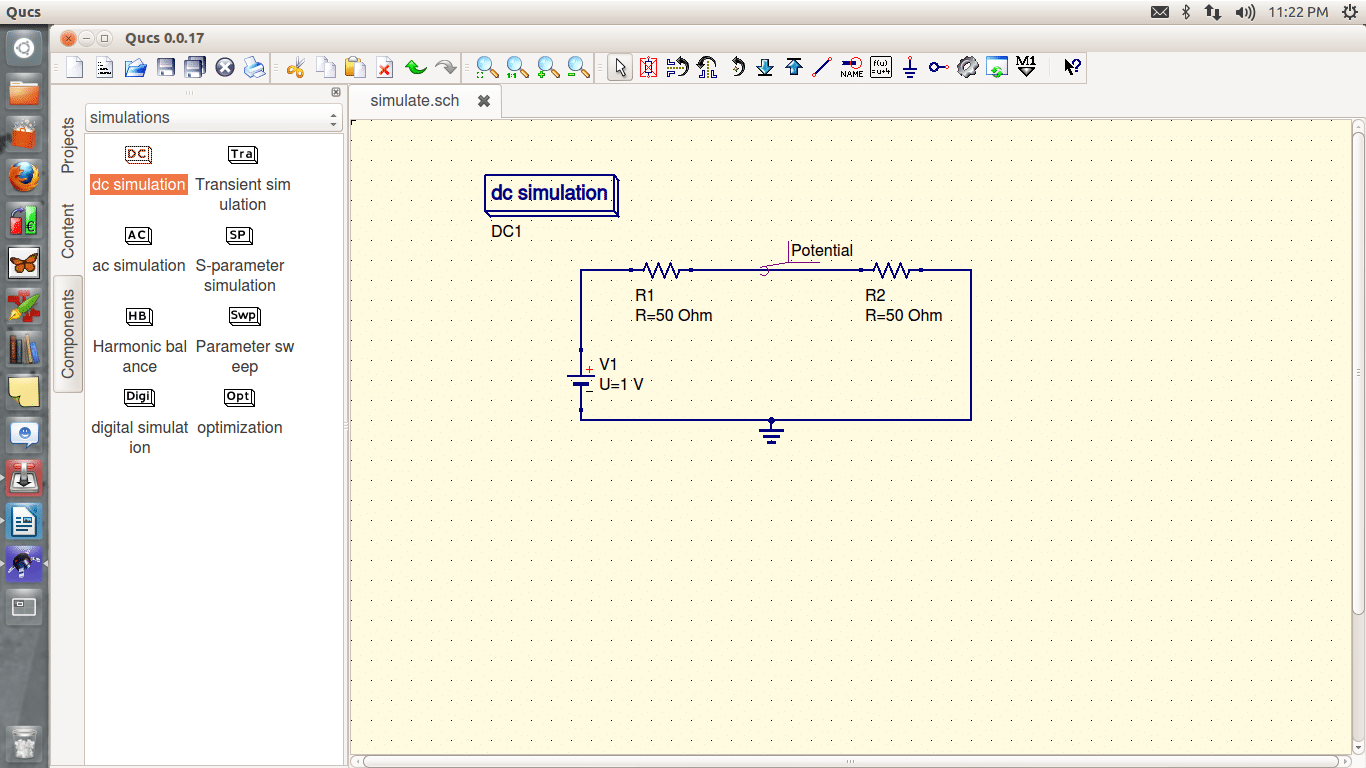
Let’s start with a simple potential divider circuit. You can find the components via the components button on the left side of the Explorer window. Place two resistors from the lumped components and a DC source from sources. Connect them using the wire (Ctrl+E) ; now place the ground symbol near the negative of the cell. (Specifying a ground point is very essential in all circuit simulators.)
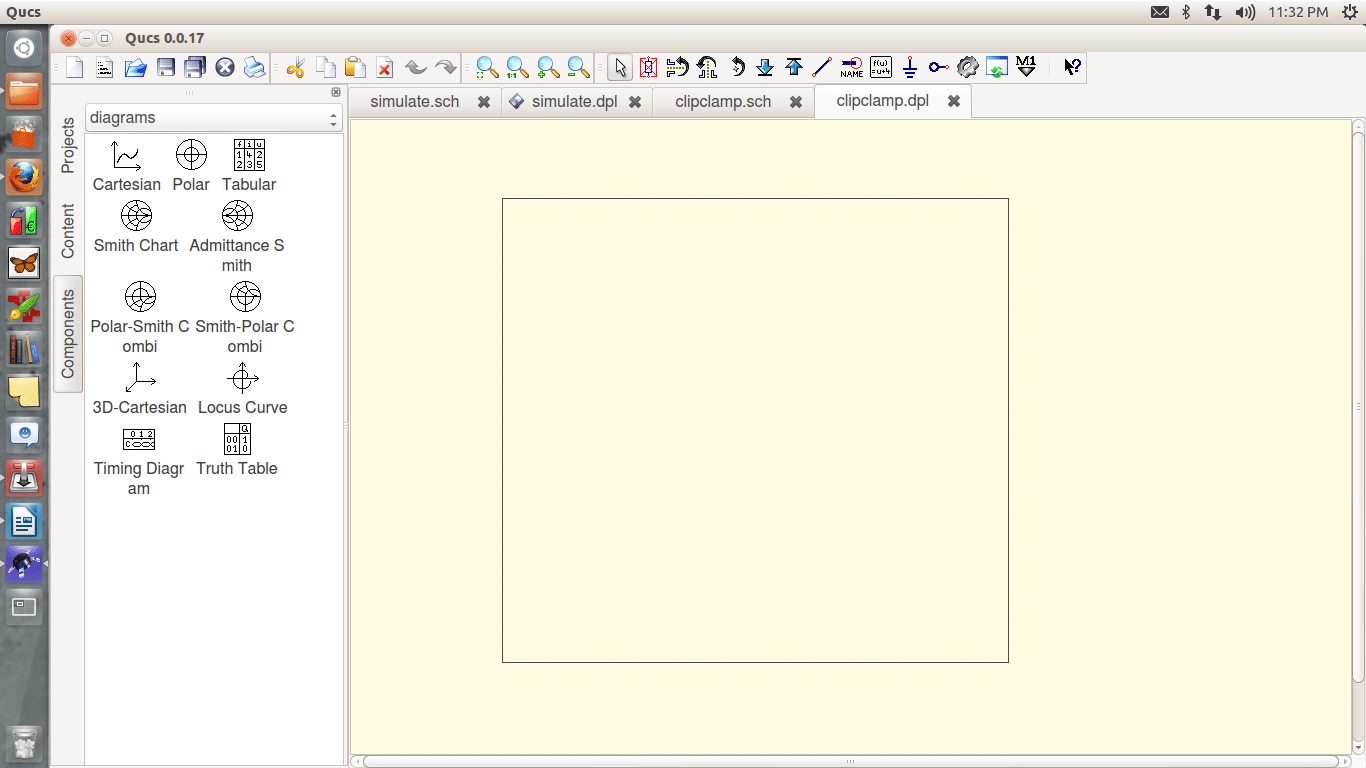
Select Insert->Wire label and click on the point between the two resistors and name it Vout (or anything you want). Now, from simulations, place the DC simulation block; the schematic should look like Figure 2. Now save it and go to Simulation ->Simulate. A new work area appears, and also the Explorer window changes to the diagram tab. From there, select a table and drag it to the work area. Choose the tabular (list of values) diagram and place it on the data display page. After dropping the tabular, the diagram dialog appears. By double clicking the Vout.V, the graph (i.e., values in a tabular plot) is added to the diagram (Figure 3). Besides the node voltage Vout.V, the current through the DC voltage source V1.I is also available. Only items listed in the dataset list can be put into the graph.
Available dataset items
Depending on the type of simulation you performed, you will find the following types of items in the dataset:
1. node.VDC voltage at node
2. name.IDC current through component name
3. node.vAC voltage at node
4. name.iAC current through component name
5. node.vnAC noise voltage at node
6. name.inAC noise current through component name
7. node.Vttransient voltage at node
8. name.Ittransient current through component name
9. S[1,1]S-parameter value
Depending on the type of the graph, you have various options to choose for it. For a tabular graph, there is number precision, as well as type of number notation (important for complex values). Press the ‘Ok’ button to close the dialogue box. You will get something like what’s shown in Figure 4. You can change the properties of the components by double-clicking on them and changing the properties in the Property box.
Parameter sweep
Now let’s look at how to plot the forward characteristics of a p-n junction diode. The diode can be obtained from the non-linear components. Since we are going to plot how voltage varies as current passing through the diode is changed, let’s use a DC current source, and change its numerical value to a variable, If. This can be done by double-clicking the component and editing the component dialogue box. Then wire up the circuit (don’t forget to ground it), and place a wire label at a point between the diode and the positive of the current source. Name it Vd.
Now place the DC simulation block and also place the parameter sweep block. In the parameter sweep properties, give the name of the DC simulation block you placed as DC1, the parameter as If (the parameter you wish to change), and then give the type of variation you want whether linear or logarithmic. Then, give the starting and ending values (I gave 0 to 10). Also give the number of points you need (100 will give you a pretty neat graph). Now simulate, and in the data display page, place the Cartesian diagram instead of the table as in the previous example, and choose the parameter you want to display. You will have the forward characteristics of the diode, with voltage on the y axis and current along the x axis.
What next?
I believe that students should be taught such simulation software along with their lab experiments, and also that students should try to use such tools when doing their projects. In this way, a lot of time and money can be saved. You can analyse how a system will respond in a given situation.
Well, I hope this information is enough to get you started. There are lots of tutorials available on the Net. There is a lot more that you can do with QUCS, like digital simulation, harmonic analysis, transient analysis, etc. If you really liked the software, try contributing back after all, FOSS is all about sharing, giving and learning.


This looks amazing. I’m looking to build my own Heliostat.
http://www.amazon.com/b?_encoding=UTF8&site-redirect=&node=130&tag=tabbooingcom-20&linkCode=ur2&camp=1789&creative=9325
The Contemporary style of Punjabi suits exclusively available on Stylizone does offer picturesque of luxury, royalty and elegance. Be it flaring or twirling Ghera dress, with the simple clicks thousand of new styles and patterns are available.
Designer Sarees Collection
Great and very informative article!
I was searching for this article wanted to know in detail about the QUCS installation and got know all about it here..Thanks for sharing…!!!
thanks and cool tips
thanks for guide and it helps newbies