


In the first of this two part series, we discussed the importance of static code analysis and the tools that can be used for it. In this article, we will discuss SonarQube integration with the Jenkins pipeline.
SonarQube checks code quality and code security to enable the writing of cleaner and safer code. It currently supports code analysis in 27 programming languages using different plugins available for the default standard rule set.
SonarQube is an automatic code analysis tool to find bugs, vulnerabilities and code smells in your source code. It can be integrated with the existing development workflow to enable continuous code analysis across project branches and pull requests. It can also be integrated directly into IDEs (Eclipse, VS Code, Visual Studio and Intellij) to find code related issues while developing code.
The workflow which should be followed for continuous static code analysis is given in Figure 1.
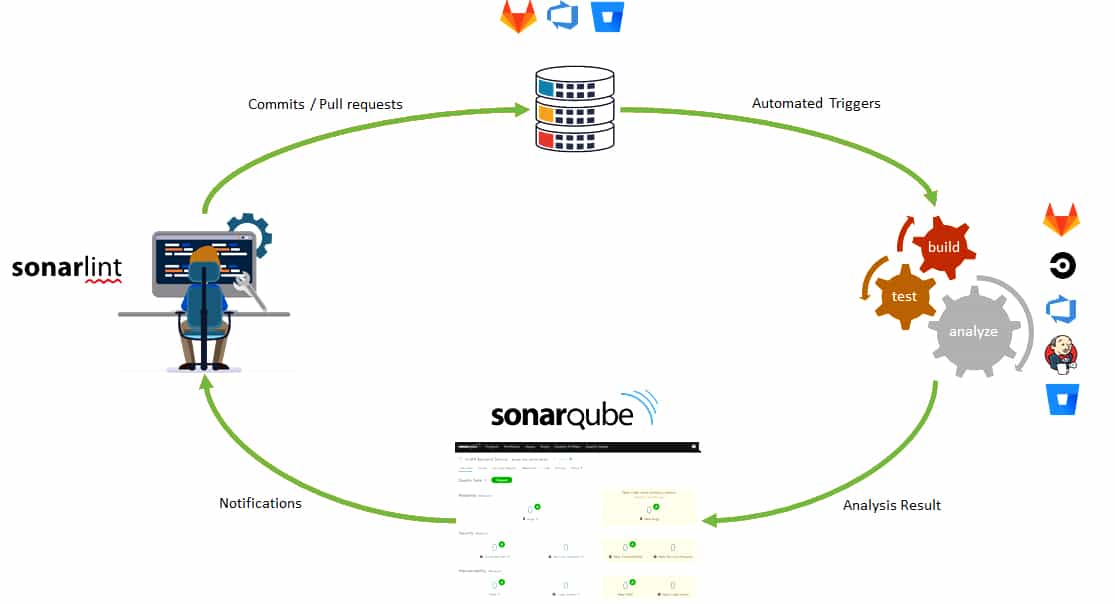
In the figure, the standard development process is shown through the following steps:
1. The developer should use SonarLint to receive immediate feedback in the IDE while coding, and then commit the code to the source code repository (GitHub, GitLab, Azure DevOps, Bitbucket).
2. Continuous integration (CI) pipeline should be triggered to produce builds, run unit tests and to analyse the source code with the help of the SonarQube scanner. CI tools that can be easily integrated with SonarQube analysis are Jenkins, GitLab, Azure DevOps, Bitbucket, and others.
3. Once the pipeline executes the analysis, the scanner publishes the results to the SonarQube server. Then the latter provides feedback to developers via the SonarQube interface, email, in-IDE notifications (via SonarLint), and decoration on pull requests. This article focuses only on integrating SonarQube analysis with the Jenkins pipeline.
Integrating SonarQube analysis with the Jenkins pipeline
To execute SonarQube analysis from an automated continuous integration pipeline we need the following:
1. Jenkins
2. Project repository (GitHub)
3. SonarQube project
| Note: Since we have used the Java Maven sample application for this setup, it will work with a Maven application. For other applications, you can refer to the SonarQube official documentation. |
If you have installed Jenkins locally, the Jenkins URL will be http://localhost:8080/. The following Jenkins plugins are required to be installed:
1. BlueOcean
2. GitHub
3. Maven Integration
4. Pipeline Maven Integration
5. Cobertura
6. SonarQube Scanner for Jenkin’s
To do so, go to Jenkins home page >Manage Jenkins >Manage Plugins >Available >Search for each plugin, and click Install without clicking the Restart button at the bottom of the page.
- Creating a token in SonarQube:
1. Go to the SonarQube dashboard. Click on My Account.
2. Then go to Security tab >Token section >Generate Tokens section, give an appropriate name to the token, and click on the Generate button to its right. - Creating Webhook in SonarQube for connection with Jenkins:
1. Go to SonarQube dashboard >Administration >Configuration >Webhooks and click the Create button on the right side to create a webhook.
2. Provide name, URL as ‘JENKINS-URL/sonarqube-webhook/’ and a secret for connection with Jenkins.
3. Click on the Create button to save.
Connecting SonarQube with Jenkins:
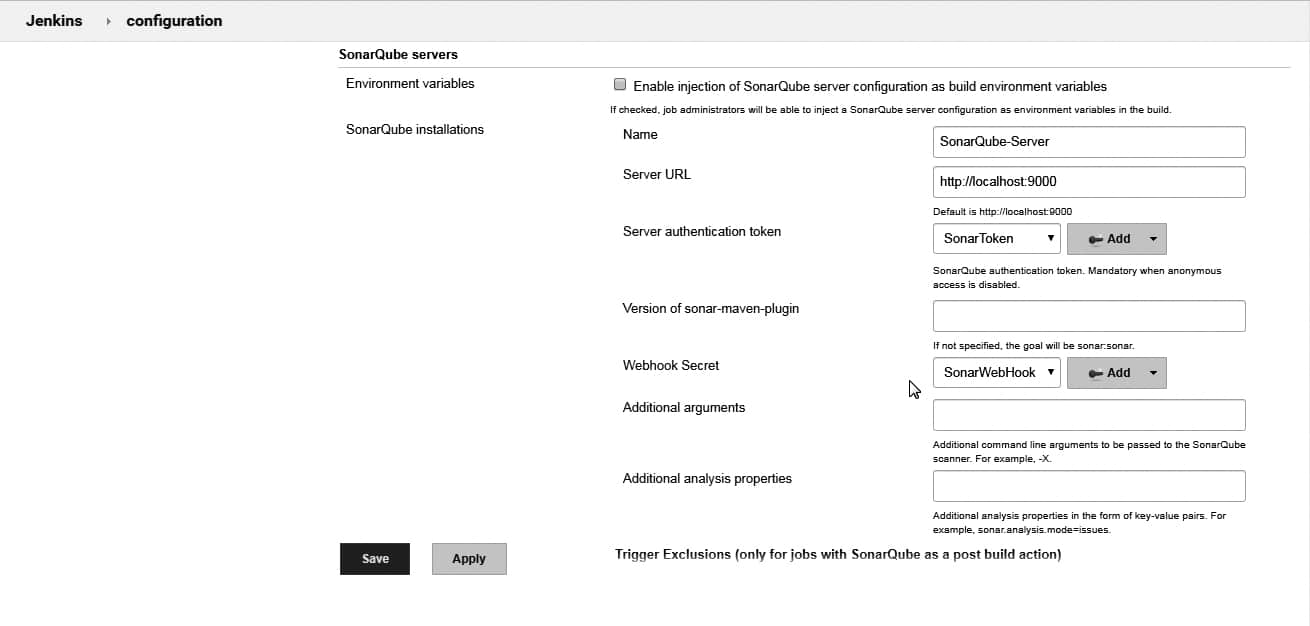
1. Go to Manage Jenkins >Configure System >SonarQube servers. Click on Add SonarQube.
2. Enter the name and the URL of the SonarQube server; for example, https://test.sonarqube-url.com/.
3. Server authentication token: Add the created token to Jenkins.
4. Select the Secret text from the drop down of Kind.
5. Copy and paste the generated token from SonarQube and provide an ID to a token. Click the Add button to save the token in Jenkins.
6. Select Secret from the drop down in SonarQube authentication token using the same ID.
7. Now click on the Advanced button to provide advanced settings.
8. Add the SonarQube webhook token to Jenkins just like we added the SonarQube authentication token as secret text.
9. Select the webhook secret from the drop-down in ‘Webhook secret’ for advanced configuration of SonarQube Server in Jenkins.
10. Save the configuration. It should look like what is shown in Figure 2.
- Managing global tools in Jenkins for JDK and Maven: Before we start with pipeline we need to configure the Maven installation and JDK installation in the global tool configuration of Jenkins.1. To do so, go to Manage Jenkins >Global tool configuration >Maven and add the path to the Maven installation on the machine (MAVEN_HOME).
2. Similarly, configure JAVA_HOME by going to Manage Jenkins > Global tool configuration >JDK.
Creating a Jenkins pipeline
Creating the initial pipeline in Jenkins:
1. Go to the Jenkins dashboard and click on Open BlueOcean.
2. Click on Create a new Pipeline.
3. Select GitHub from the available repository option in the BlueOcean dashboard.
4. Click on Create an access token here link available in the BlueOcean dashboard. You will be taken to the GitHub page to create PAT. Provide a name to an access token, copy the new access token, and save it in a safe place in case you want to refer to it later.
5. Paste the access token copied from GitHub into the BlueOcean dashboard, where we are trying to create a pipeline, and try to connect.
6. On successful connection, you will find all your organisations in the drop-down menu. Select the organisation from GitHub that contains the repositories that you want to use in the Blue Ocean pipeline.
7. Select a repository and click on Create pipeline.
8. Search for the pipeline in the Blue Ocean dashboard, and click on it. It will ask you again if you have a Jenkinsfile in the repository. So hit the Create pipeline option to create the Jenkins pipeline file in your project.
9. Give the name of the build agent as Master (or the name of the agent where you want to build the pipeline).
10. For now, you can add one stage ‘Continuous Integration’ with a sample echo bash script. Save and commit it to GitHub again.
Now we have the Jenkinsfile with the ‘Continuous Integration’ stage in our GitHub repository. We will just update this file in the next steps.
Unit test, Maven Java code and publishing the code coverage report in Jenkins: SonarQube is not capable of generating the units and code coverage results by itself. It imports the reports executed by the test framework used in the project. As we will refer to the Maven application, the test framework used in this implementation is Junit. And we will use Cobertura and Jacoco plugins from Maven for the generation of code coverage.
To do so we need to include these plugins in pom.xml. The code below is the main file for all Maven project related configurations. Please refer to the pom.xml code below for unit test and code coverage of Java applications.
<build>
<plugins>
<plugin>
<groupId>org.jacoco</groupId>
<artifactId>jacoco-maven-plugin</artifactId>
<version>0.7.5.201505241946</version>
<executions>
<execution>
<goals>
<goal>prepare-agent</goal>
</goals>
</execution>
<execution>
<id>report</id>
<phase>prepare-package</phase>
<goals>
<goal>report</goal>
</goals>
</execution>
<execution>
<id>jacoco-check</id>
<goals>
<goal>check</goal>
</goals>
</execution>
</executions>
</plugin>
<plugin>
<groupId>org.codehaus.mojo</groupId>
<artifactId>cobertura-maven-plugin</artifactId>
<version>${cobertura.version}</version>
<configuration>
<formats>
<format>xml</format>
</formats>
</configuration>
<executions>
<execution>
<phase>package</phase>
<goals>
<goal>cobertura</goal>
</goals>
</execution>
</executions>
</plugin>
<plugin>
<groupId>org.sonarsource.scanner.maven</groupId>
<artifactId>sonar-maven-plugin</artifactId>
<version>3.6.0.1398</version>
</plugin>
</plugins>
</build>
Now, to create a Jenkins pipeline, create a Jenkinsfile in the source code repository. Add the script below to implement unit test cases and code coverage:
pipeline {
agent {
node {
label ‘master’
}
}
stages {
stage(‘Continuous Integration’) {
steps {
withMaven(jdk: ‘JAVA_HOME’, maven: ‘MAVEN_HOME’) {
bat ‘mvn clean’
bat(script: ‘mvn test cobertura:cobertura install’, label: ‘Unit Testing and Code Coverage’)
cobertura(autoUpdateHealth: true, autoUpdateStability: true, classCoverageTargets: ‘target/site/cobertura/’, coberturaReportFile: ‘target/site/cobertura/*.xml’, failUnstable: true, zoomCoverageChart: true)
}
}
}
}
}
The Jenkinsfile in the code above includes the steps given below in the pipeline:
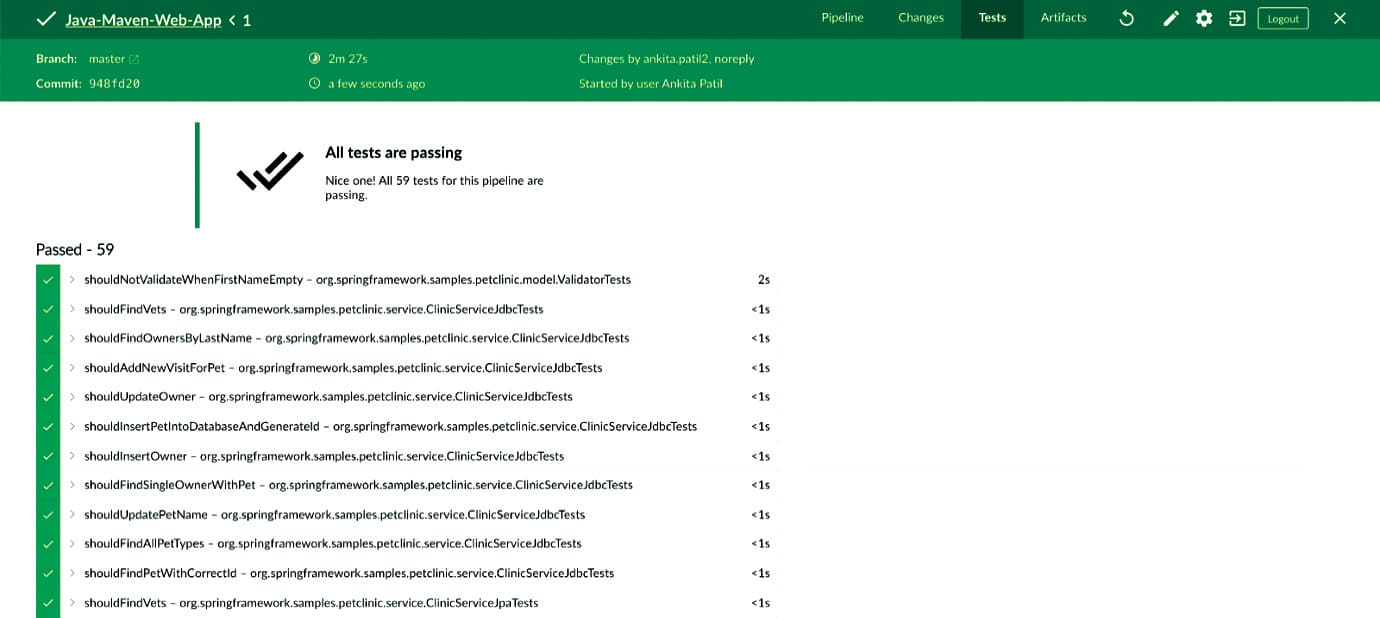
1. Execute unit test result and Cobertura code coverage. Get the reports in a SonarQube acceptable format (SonarQube supports JUnit, Cobertura and Jacoco reports).
2. Publish the unit test and coverage reports to the Jenkins dashboard. Save and run the pipeline in Jenkins again. On successful execution of unit testing, it will publish the results shown in Figure 3.
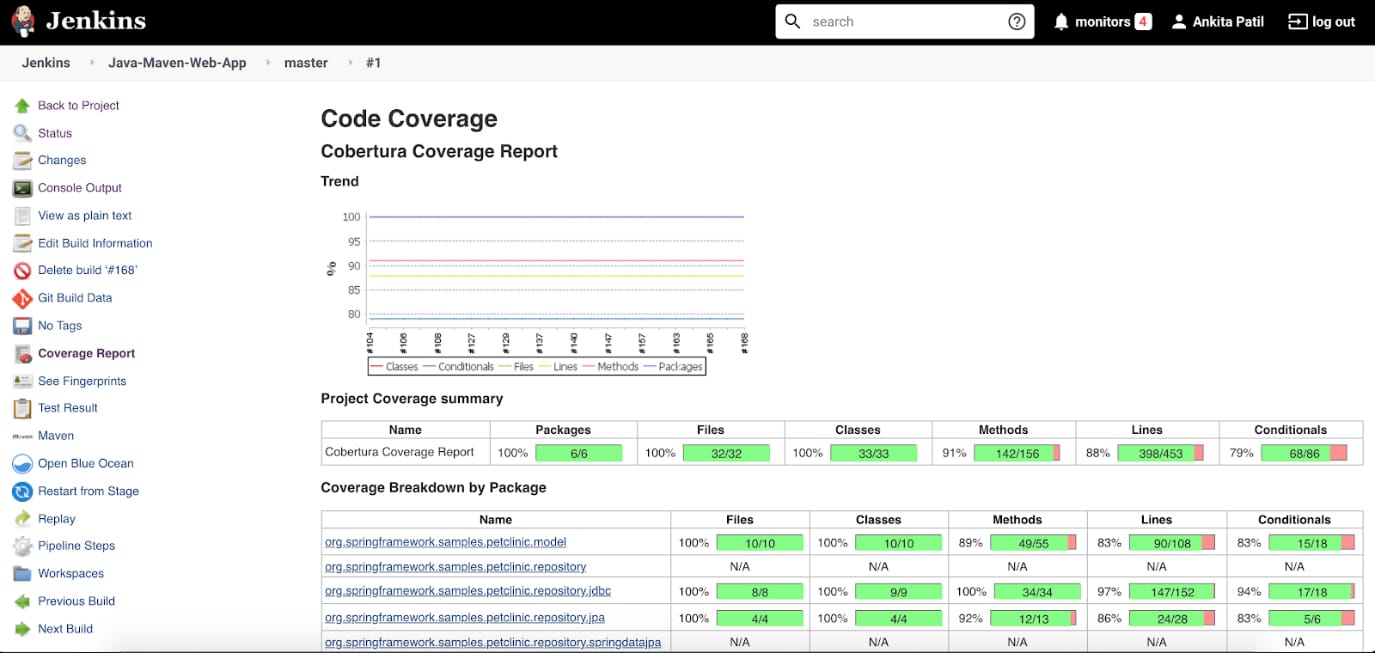
The code coverage report looks like what is shown in Figure 4.
Implementing SonarQube analysis from Jenkins pipeline: First, create the sonar-project.properties file in the root of the repository. This file is used to define the analysis parameter, which we need to provide to the SonarQube scanner during analysis.
The sample sonar-project.properties file for our Maven application is in the code below:
sonar.projectKey=java-sonar-runner-sample
sonar.projectName=Simple Java project analyzed with the SonarQube Runner
sonar.projectVersion=1.0
# Comma-separated paths to directories with sources (required)
sonar.sources=src/main
sonar.tests=src/test
sonar.java.binaries=target/classes
sonar.java.test.binaries=target/test-classes
#Unit Test And Code Coverage
sonar.junit.reportPaths=target/surefire-reports
sonar.java.cobertura.reportPath=target/site/cobertura/coverage.xml
sonar.coverage.jacoco.xmlReportPaths=target/site/jacoco/jacoco.xml
sonar.sourceEncoding=UTF-8
Now, referring to this property file we need to perform SonarQube analysis from Jenkins. So update the Jenkinsfile, and add in it the code given below for the ‘Continuous Integration’ stage to perform SonarQube analysis (the code below has the entire Jenkinsfile for unit testing and SonarQube analysis):
pipeline {
agent {
node {
label ‘master’
}
}
stages {
stage(‘Continuous Integration’) {
steps {

withMaven(jdk: ‘JAVA_HOME’, maven: ‘MAVEN_HOME’) {
bat ‘mvn clean’
bat(script: ‘mvn test cobertura:cobertura install’, label: ‘Unit Testing and Code Coverage’)
cobertura(autoUpdateHealth: true, autoUpdateStability: true, classCoverageTargets: ‘target/site/cobertura/’, coberturaReportFile: ‘target/site/cobertura/*.xml’, failUnstable: true, zoomCoverageChart: true)
}
withSonarQubeEnv(installationName: ‘SonarQube-Server’, credentialsId: ‘SonarToken’) {
bat(script: ‘D://Softwares//sonar-scanner-cli//sonar-scanner-4.3.0.2102-windows//bin//sonar-scanner -Dproject.settings=sonar-project.properties’, label: ‘SonarQube Analysis’)
}
waitForQualityGate(abortPipeline: true, credentialsId: ‘SonarToken’, webhookSecretId: ‘SonarWebHook’)
}
}
}
}
The code has referenced the SonarQube server (SonarQube-Server), SonarToken and SonarWebhook, which we configured in the ‘Manage Jenkins with Jenkins and SonarQube’ setup.
The two steps performing SonarQube analysis in Jenkinsfile above are:
1. withSonarQubeEnv: SonarQube analysis using sonar-scanner in batch script and the sonar-project.properties files we created.
2. waitForQualityGate: Checking for the ‘quality gate’ status after the SonarQube analysis is executed.
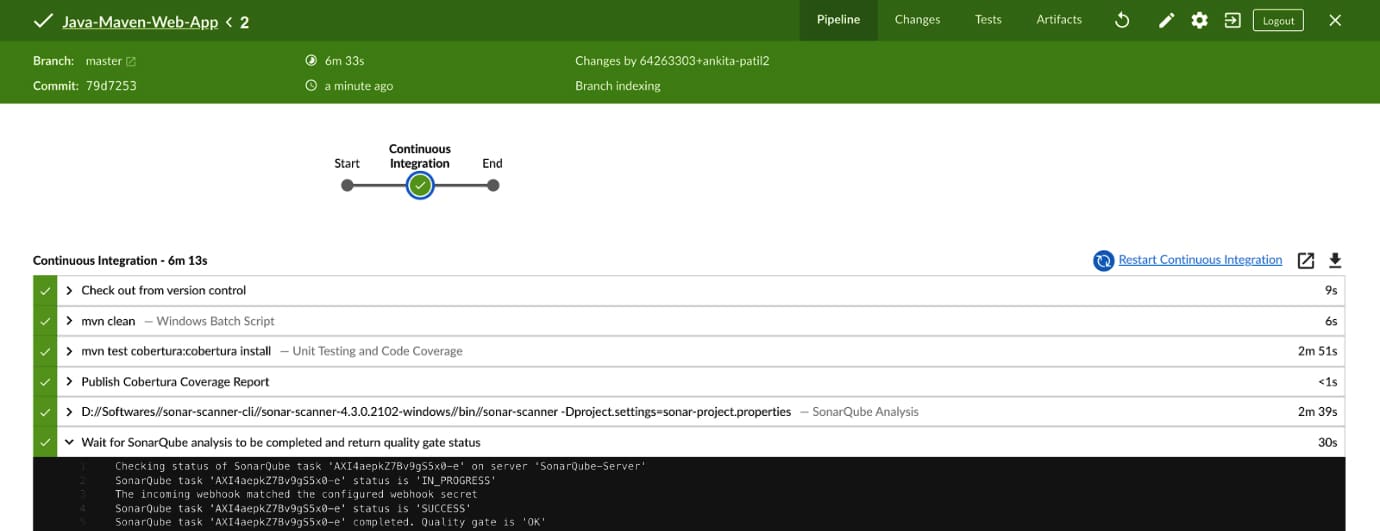
Save the pipeline and run it again. On its successful execution, we will be able to find ‘quality gate’ results in the Jenkins pipeline console, as shown in Figure 5.
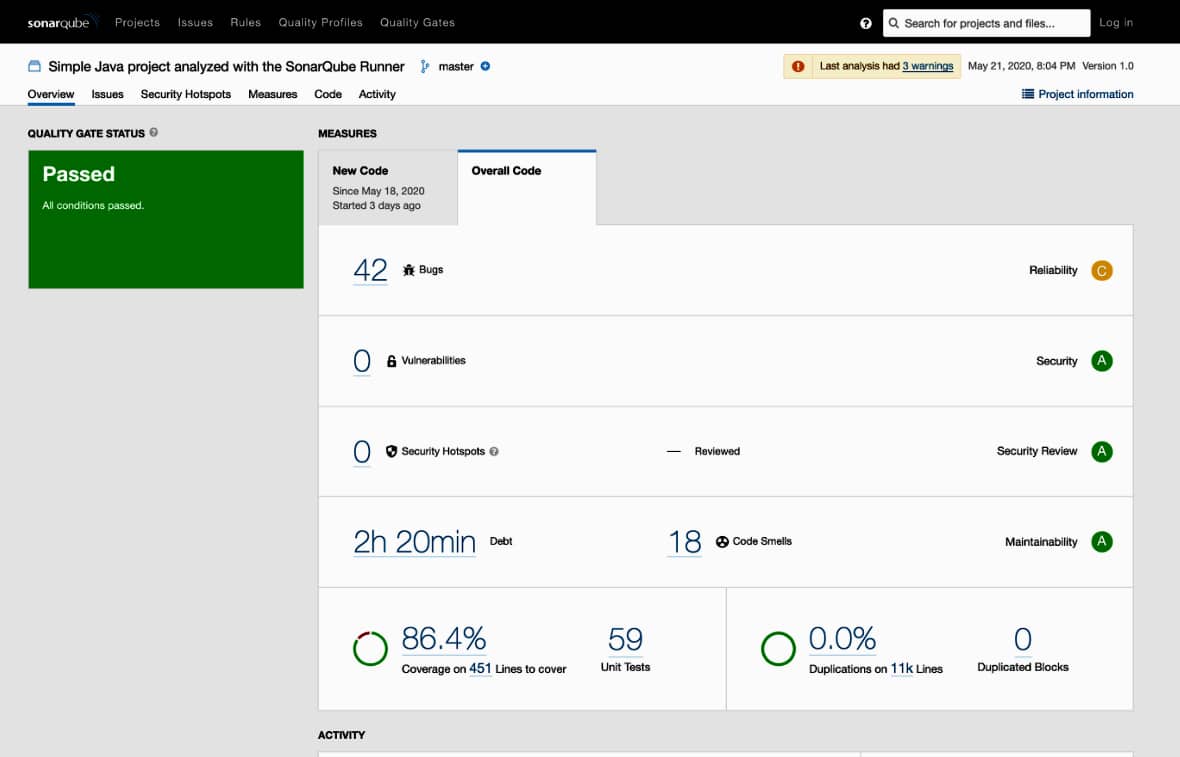
The SonarQube analysis result on the SonarQube server looks like what’s shown in Figure 6.
We have now successfully analysed the Maven Java application using SonarQube analysis in Jenkins CI pipeline.
Understanding the SonarQube analysis report from its project dashboard
Once we analyse the source code and the result is published on the SonarQube server, we can see the entire report of issues, code coverage and duplications on a single dashboard.
Let us first understand the different kinds of issues we see in Figure 6.
1. Reliability issues: Bugs — these are coding errors that will break your code at some point of time and need to be fixed immediately.
2. Security issues: Vulnerabilities and security hotspots are issues in your code that are open to attack.
3. Maintainability issues: Code smells make your code confusing and difficult to maintain. If these issues are not taken care of, they can lead to high technical debt.
Whenever you see issues in the SonarQube project, you need to click on the Issues tab besides Overview, to view and navigate through them and look at what is causing them. This will help you to change state or priority, comment, or assign the issue to the team.
On the dashboard, we also see code coverage and unit test cases. These are the result of the code coverage report generated by Jacoco and Cobertura and of the unit test results generated after successful execution of the Junit test case. If you click on Code coverage percent it will take you to code that is covered by unit test cases.
SonarQube also analyses duplication of code in the files being looked at. This is also published to the dashboard.
In the first part of this two-part series, we learnt that static code analysis is an important part of the software development life cycle (SDLC) to build the best quality software. It has lots of benefits if it is adopted from the start of the software development process. We also covered the top five tools available to perform static code analysis on your code.
SonarQube is one of the most widely used tools for code analysis. In this article, we have covered how to configure SonarLint, GitHub app, and pull request decoration with GitHub and SonarQube. Lastly, we created a Jenkins pipeline to perform SonarQube analysis on a Maven application.


