























































Let’s see how eBPF works and get hands-on with some sample programs.
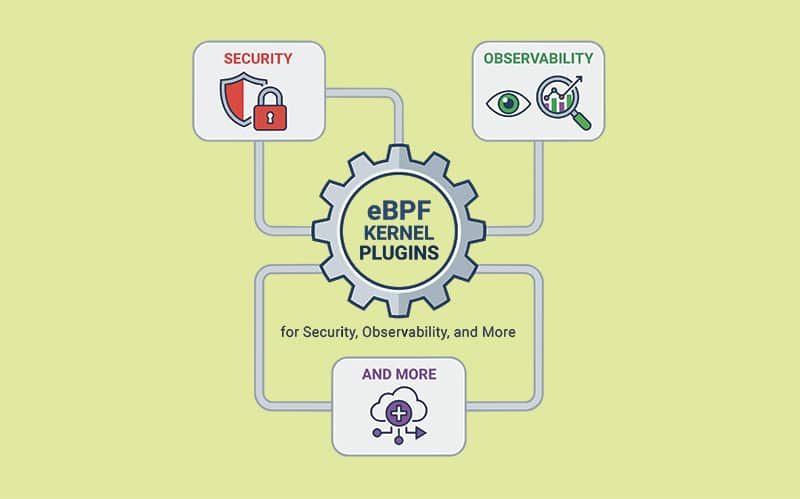
eBPF is surprisingly popular for a kernel-level technology. Forget the books and tutorials – there is a foundation, an ACM SIGCOMM workshop, and even a documentary about it! Why so? Marketed as ‘JavaScript for the kernel’, eBPF lets us write high-performance dynamic plugins for the Linux kernel, with use cases ranging from tracing to custom schedulers. Keeping an eye on eBPF is a smart move even if you don’t want to write eBPF programs manually – tools and frameworks based on this technology are making a revolution in the areas of observability and security. This revolution is not just limited to Linux-based hosts; there are SmartNICs (hardware) that support eBPF, and Microsoft is actively working on adding eBPF support to Windows. According to ebpf.io, eBPF is used by large Internet companies including Google, Meta, Cloudflare, and Netflix for one purpose or another.
What makes eBPF powerful is that eBPF programs get to run in kernel space, where it can hook to so many critical points and intercept operations to tap and manipulate data. You can do a lot of things at these levels that you cannot do in user space (like participating in process scheduling). You get to do so many things sooner as well (like checking and dropping a packet before it even enters the kernel network stack).
So what makes eBPF so special, especially compared to existing solutions like kernel modules which also help us extend the kernel? Well, kernel modules can be far more capable than eBPF programs – you are essentially developing a chunk of the kernel. But eBPF programs do not have the same level of freedom. They have many restrictions enforced by the kernel. While this sounds disappointing, these restrictions actually make extending the kernel a fearless activity – there is no way we can crash the kernel with a buggy eBPF program unless there is a bug in the kernel itself.
Powered by eBPF
There are celebrated projects like Cilium that bring massive performance and security benefits to the cloud with the help of eBPF. Cilium is a high-performance Container Networking Interface for Kubernetes. It replaces the traditional kube-proxy and iptables-based workflow, which has significant overhead compared to eBPF-based load balancing and routing done at the lowest level possible. However, let’s focus on some other tools that are both powerful enough to be used on real servers and simple enough to try on our personal laptops.
Since eBPF started as an extended version of the classic ‘Berkeley Packet Filter’, it has found its way into some existing firewall solutions, and newer ones are being built based on it. One noteworthy solution is bpfilter, which translates network filtering rules to eBPF programs. We do not have to manually load these programs; bpfilter will take care of that for us (in fact, bpfilter originated as a drop-in replacement for iptables).
bpfilter comes with a command-line utility called bfcli, which is used to install and manipulate filtering chains. Here is an example that drops all ICMP packets, essentially blocking ping:
# Load the chain

sudo bfcli chain load --from-str “

chain my_xdp_chain BF_HOOK_XDP ACCEPT

rule

ip4.proto eq icmp

counter

DROP”
# Attach to the interface (use `ip a` to find ifindex)
sudo bfcli chain attach --name my_xdp_chain --option ifindex=2
# Try pinging now
# Reset
sudo bfcli chain flush -n my_xdp_chain
You can try pinging from another machine before and after attaching the chain to see that it actually works.
bpfilter is meant to be full-fledged, supporting filtering at various levels of the network stack. This includes XDP (eXpress Data Path), an eBPF-based kernel feature that lets packets to be filtered at the NIC driver level (with or without hardware support). This way, filtering happens before packets enter the kernel network stack, making it a high-performance solution. This is why XDP is often picked for DDoS mitigation.
Visit bpfilter.io and their GitHub repository for more information; installation is easy, but out of scope of this article. There is also a project called xdp-filter, which is a packet filter that focuses exclusively on XDP.
Another area where ready-made eBPF tools are available is observability. bpftrace is a tool that lets us write small programs to monitor kernel events and collect statistics. It accepts source programs in an AWK-like language and converts them to eBPF programs internally. The language was inspired by the D language used by DTrace, another UNIX kernel tracing solution.
Here is an example command that logs every time some process removes a directory:
bpftrace -e ‘tracepoint:syscalls:sys_enter_rmdir {

printf(“%s removed some directory\n”, comm); }’
After loading our tracing program like this, create an empty directory and remove it (either using GUI or by issuing commands in a different terminal). You can see that the directory removal is being logged. The process can be terminated using Ctrl+C as usual.
How eBPF works
So far, our understanding is that eBPF is a technology that lets us inject custom code into the operating system kernel on the go. Let’s go a bit deeper than that.
An eBPF program is essentially an executable binary in the ELF format (similar to any other compiled program you run on Linux-based systems). The key difference is that it contains instructions in the eBPF bytecode instead of actual machine code. One could write eBPF programs in Assembly, C, etc, and get them compiled using Clang or any other supported compiler.
Now we need a user-space ‘loader program’, which sends the eBPF program to the kernel by issuing a bpf() system call. There are libraries available in languages including C, Go, and Python to make this far easier. The loader program can also stick around and communicate with the eBPF program to collect data and perform complex operations.
Once the program is sent to the kernel, it is inspected by a key component called ‘the eBPF verifier’, which makes sure the program is free of infinite loops and illegal operations. If the program passes, it gets compiled to native machine code (say x86_64) by a JIT compiler. After that, the program is ready for direct execution in the kernel space. This whole process is given in Figure 1.
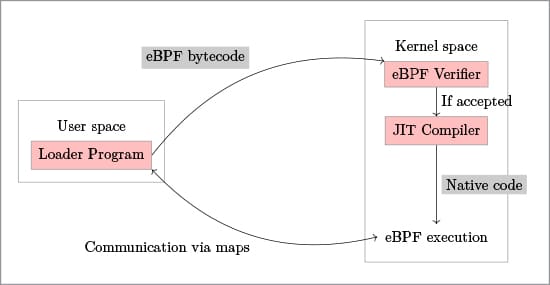
eBPF execution is event-driven. So, when an eBPF program gets executed depends on what hook it was attached to. Some example hooks include XDP (useful for high-performance filtering of network packets) and syscall tracepoints (triggered for system calls like open(), unlink(), fork(), etc).
Another key concept in the eBPF infrastructure is maps. These are data structures like arrays, queues, hash maps, etc, shared between eBPF programs and their loader programs for communication between the kernel space and the user space.
Programming and deploying eBPF
We just saw that one has to write two programs – a user space loader and the actual eBPF program – if one wants to go deeper than high-level tools like bpftrace or bpfilter. While both can be written in high-level languages, doing so without depending on some framework would be very difficult.
Some popular eBPF development frameworks/methods are BCC (BPF Compiler Collection), libbpf-bootstrap, and eunomia-bpf. We’ll pick libbpf-bootstrap for this article as it’s a good starting point while still being portable and supported by some of the kernel eBPF maintainers.
libbpf-bootstrap is essentially a collection of sample eBPF programs with all the setup code and a Makefile (which are tedious to write, hard to get right, and distracting). The idea is that one could pick a suitable example as a playground or a template for a serious project (sticking to the licence, which is BSD 3-Clause at the time of writing this).
The most minimal example in this collection is a program called minimal. Let’s see how to build and execute it.
First, make sure your system has git, make, gcc, clang, and libelf-dev. Then run the following commands:
1. git clone --recurse-submodules https://github.com/libbpf/ libbpf-bootstrap

2. cd libbpf-bootstrap/examples/c

3. make minimal

4. sudo ./minimal
When we ran sudo ./minimal, we just started the user-space component that injects the actual eBPF program into the kernel. This should print a success message and wait. We can open a new terminal and enter the following command to see the output from the eBPF program:
sudo cat /sys/kernel/debug/tracing/trace_pipe
This will keep printing ‘bpf_trace_printk: BPF triggered from PID ….’ Killing the loader program by pressing Ctrl+C in the first terminal will detach the eBPF program from the kernel, at which point there will be no new logs in the second terminal (unless some other program is printing to it).
Alright, we loaded an eBPF program, and it kept printing a message every second. What is happening here?
Let’s check the relevant part from minimal.bpf.c, the eBPF program:
SEC(“tp/syscalls/sys_enter_write”)

int handle_tp(void *ctx)

{

...

bpf_printk(“BPF triggered from PID %d.\n”, pid);

return 0;

}
The first line says that the eBPF program is to be triggered whenever the write() system call is called. write() is what makes high-level output functions like printf() and fwrite() possible. So, this eBPF program has the potential to trace all such output operations by any process (except that the example from the libbpf-bootstrap repo contains a check to filter out the ones from sources other than our loader).
Now what does the loader program (minimal.c) contain? After all the setup code, it contains this:
for (;;) {

/* trigger our BPF program */

fprintf(stderr, “.”);

sleep(1);

}
That is, it prints a dot every second, triggering the eBPF program as discussed above.
For an exercise, make the following changes to minimal.bpf.c and redo everything from make minimal to loading the programs and observing the logs:
- Change SEC(“tp/syscalls/sys_enter_write”) to SEC(“tp/syscalls/sys_enter_rmdir”).
- Remove the pid check so that rmdir() issued by any process will be handled.
Once the program is loaded and you are observing the output, create an empty directory and remove it (again, either using GUI or the commands). You can see that the directory’s removal is logged by our eBPF program. Well, our bpftrace attempt was much simpler than this, but remember that here the possibilities are virtually unlimited compared to bpftrace.
Here are three tools that could make eBPF development and management easier:
- bpftop: Real-time view of running eBPF programs, like with top and htop.
- bpftool: Inspection and manipulation of eBPF programs and maps.
- llvm-objdump: Disassemble eBPF bytecode (so that you can inspect the Assembly code).
More to explore
There are many layers to work at if you are enthusiastic about eBPF. You can make use of technologies built on top of eBPF (as a sysadmin), you can develop tools that generate or manipulate eBPF programs (as a compiler engineer), or you can even work on the eBPF-related parts of the kernel, especially the verifier. Potential loopholes in the verification are always a concern. At the same time, false alarms resulting from stricter verification can make eBPF development a frustrating experience. This is why many people are interested in improving the verifier.
Now, make sure to visit ebpf.io and ebpf. foundation, where you can learn more about eBPF, its applications, and opportunities.