











































A walk through the unseen plumbing that decides whether your favourite app stays online tonight.
Last summer I was visiting family in Bengaluru when the power went out. Standard monsoon stuff. The fan stopped, the lights died, and for about ninety seconds, everyone went quiet, waiting. Then the UPS kicked in. The router blinked back to life. My laptop reconnected to the WiFi. My cousin’s PlayStation resumed downloading some massive updates. Within two minutes, the household had collectively forgiven the grid and moved on with its evening.
I remember thinking, this is what a modern data centre does, a thousand times an hour, for ten thousand different services, in ways the people using those services never see. Something fails. Something else picks up the slack. A handful of engineers somewhere notice the blip on a graph, mutter something under their breath, and the rest of the world keeps streaming, scrolling, and shopping without a clue.
That invisible recovery is, in large part, what observability is for. Not the buzzword version that gets thrown around in vendor pitches. But the actual day-to-day practice of knowing what’s happening inside thousands of machines, services, and connections so that when something starts to wobble, someone can catch it before users notice.
I want to take you on a walk through that world. Not from the architect’s perspective, with neat diagrams and clean abstractions. From the perspective of the people who sit in front of those dashboards at 3 a.m. with cold tea and aging eyes, trying to figure out what changed.
A data centre is not a building; it’s a conversation
When people think of a data centre, they usually picture rows of black rack-mounted servers behind glass doors, with blue and green lights blinking in unison. That’s the photograph version. The reality is more interesting.
A modern data centre is closer to a city than a building. There are residents, the workloads. There are roads, the network. There are utility companies, and storage and compute providers. Some services run quietly in the background, like DNS, like load balancers, like time synchronisation. There are emergency responders, the on-call engineers and their automation. And every second of every day, this whole city is in motion, with millions of conversations happening simultaneously, most of which nobody is watching.
What changed over the last fifteen years isn’t really the hardware. Servers are servers. Disks are disks. What changed is the way workloads move around. A single application used to live on a single machine. Now it lives in a dozen containers spread across three availability zones, each of which can be replaced at a moment’s notice. That kind of fluidity is wonderful for resilience. It’s also a nightmare for understanding what’s going on.
Which is exactly where observability comes in.
What we mean when we say observability
The word gets used loosely. Vendors love it. Marketing teams love it. The actual definition, borrowed from control theory, is the ability to understand a system’s internal state by looking at its external outputs.
That’s the formal version. The everyday version is simpler. Observability is the difference between ‘the website is slow’ and ‘the website is slow because the user service is hitting a connection pool limit, which started ten minutes ago when the recommendations service began retrying failed requests, which started because the model cache invalidated after a deploy, which kicked off a thundering herd of cache misses.’
The first is information. The second is understanding. Getting from one to the other is what observability tools are built to support.
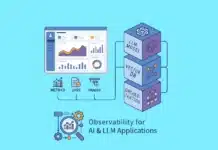
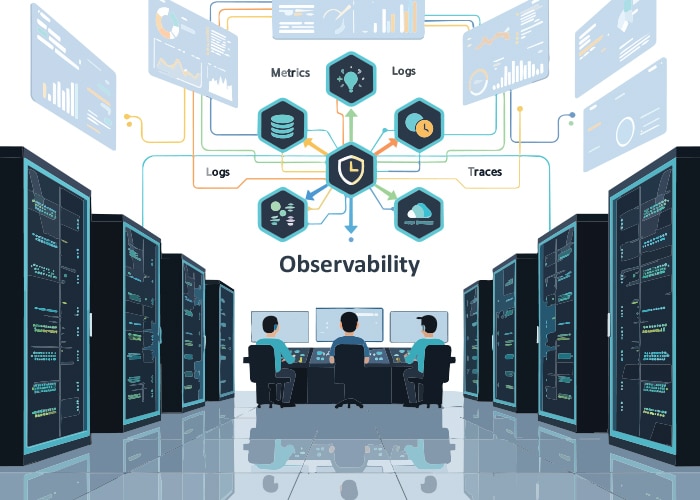
Most discussions break observability into three pillars. Metrics, the numerical measurements you collect at regular intervals. Logs, the text events your applications produce when something happens. Traces, the records of how a single request moved across multiple services. You need all three to understand what’s happening inside a modern data centre.
Any one of them on its own gives you a partial picture at best.
Why a single server with htop won’t cut it anymore
For a long time, the way you knew your system was healthy was by SSHing into it and running tools like top, htop, vmstat, or iostat. You looked at the screen. You saw CPU at fifty percent. You shrugged and moved on.
That model dies the moment you have more than a handful of machines. And modern data centres have thousands. Tens of thousands. Some of them, hundreds of thousands. You cannot SSH into each one. You cannot eyeball each terminal. You need a way to collect signals from everywhere and bring them to one place where humans and automation can both look at them.
That’s the basic shape of every observability stack. Agents on every machine and inside every service, pushing or pulling data to a central system. Storage that can handle billions of data points over time. Query languages that let you slice the data in useful ways. Dashboards and alerts on top of all of it.
The tools have specific names. Prometheus and VictoriaMetrics for metrics. Loki, Elastic, and OpenSearch for logs. Jaeger, Tempo, and Zipkin for traces. Grafana for visualisation. OpenTelemetry is the increasingly common standard for emitting all three kinds of data from your applications. We’ll touch on some of these as we go, but the names matter less than understanding why the categories exist.
Walking through a typical incident
Let me sketch a typical incident to make this concrete.
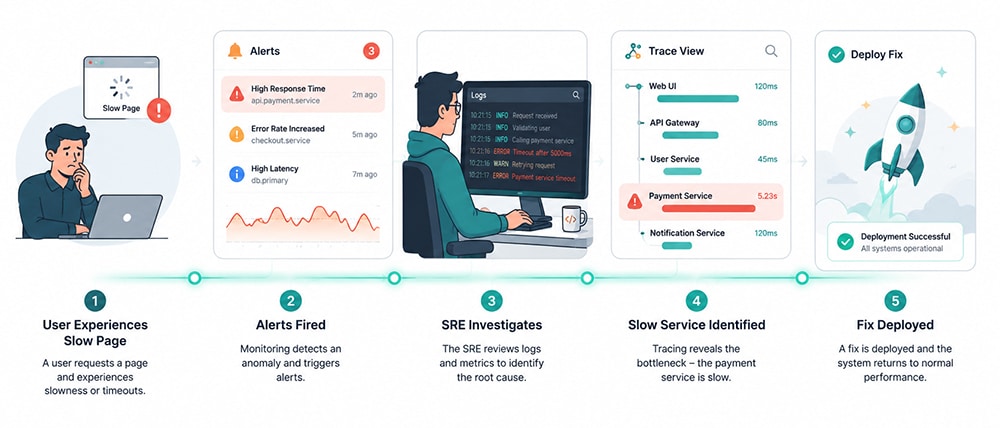
Tuesday evening, around eight. Traffic to a streaming service is high but not unusually so. Suddenly the on-call engineer’s phone buzzes. An alert. Page load latency in one region has crossed the five-second mark, which is the threshold for waking somebody up.
The engineer opens the laptop, navigates to the main Grafana dashboard, and sees what’s going on. P95 latency is climbing steadily across all services in that region. CPU and memory look normal. So it’s probably not a resource issue.
They click through to the service-by-service breakdown. Most services are fine. But the recommendations service is showing elevated error rates and slow response times. Other services are slow because they’re waiting on it.
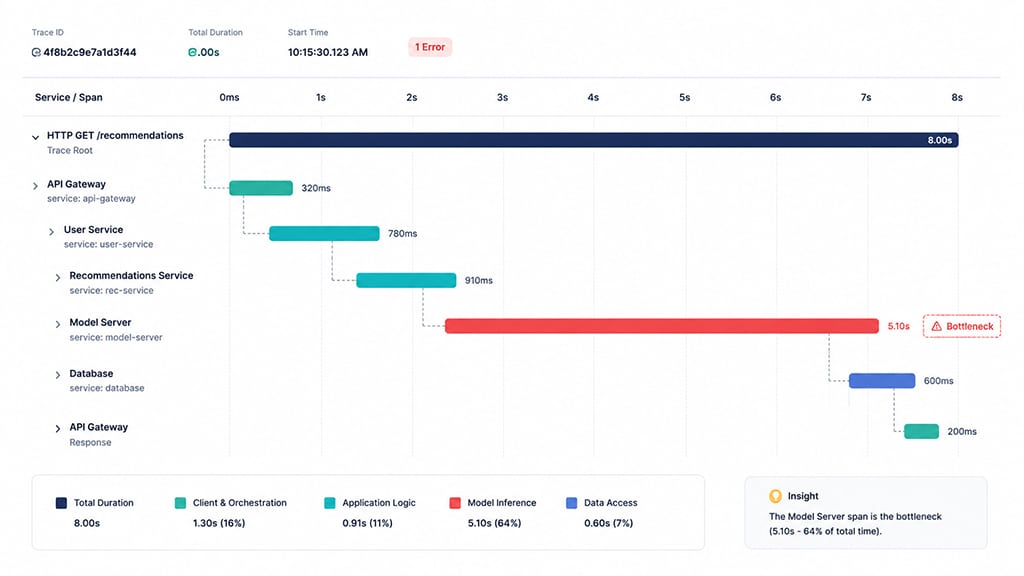
They jump to the logs for the recommendations service. A flood of timeout errors talking to the model server. They go to the trace view, pick a recent slow request, and see the entire flow. Frontend to API gateway to user service to recommendations service to model server. The model server is taking eight seconds to respond, when it should take under two hundred milliseconds.
A quick check of recent deployments. Yes, the model server got a new version pushed two hours ago. The engineer rolls back. Latency recovers within ninety seconds. They write a quick note in the incident channel, file a ticket for the postmortem, and go back to dinner.
Total time from alert to resolution, about eight minutes. Without observability tooling, the same incident might have taken hours, lots of guessing, and probably a few wrong fixes along the way.
Metrics are the heartbeat of the city
Of the three pillars, metrics are usually where teams start. They’re cheap to collect, cheap to store, and cheap to query. They give you the broad shape of what’s happening.
Prometheus is the open source heavyweight in this space. It pulls metrics from every service and stores them in a time-series database. You can write queries to slice and aggregate the data in basically any way you can imagine.
The catch with metrics is that they tell you what, but not always why. They tell you that the error rate jumped. They don’t tell you which user, which request, which line of code. For that, you need to drop down to logs and traces.
Logs are the diary, but a chaotic one
Logs are the oldest form of telling the computer to tell you what it did. Every application is designed to emit them. Every server collects them. The challenge has never been getting logs. The challenge has always been finding the one log line that matters in a sea of millions.
The modern approach is structured logging. Instead of printing free-form strings, applications emit logs as JSON or similar formats with consistent fields. That way you can query them.
Tools like Loki, Elastic, and OpenSearch handle log storage at scale. They index the data so queries are fast. They typically have a dashboard interface, like Kibana for Elastic or Grafana for Loki, where you can search, filter, and visualise.
Traces are the map of how requests really travel
Traces are the youngest of the three pillars, and the one most people understand least, even though they’re often the most useful when things go wrong.
A trace follows a single request as it moves through your system. The browser sends a request to the gateway. The gateway calls the user service. The user service calls the database and the recommendations service. The recommendations service calls the model server. Each of these hops gets recorded as a span. All the spans for one request get linked together as a trace.
When you look at a trace in a tool like Jaeger or Tempo, you see a waterfall view. Each span is a horizontal bar. The width tells you how long it took. You can see exactly where time was spent. If the recommendations service is taking eight seconds, you can see whether it was the model server call, the database query, or something else entirely.
The work of getting good traces is mostly about instrumentation. Each service needs to know how to receive an incoming trace context, pass it along to downstream calls, and emit its own spans. OpenTelemetry has emerged as the standard way to do this, and most modern languages and frameworks have OpenTelemetry libraries that handle most of the work automatically.
Where SLOs come in
There’s one more concept that needs to be in this conversation — Service Level Objectives (SLOs).
The basic idea is simple. You define what acceptable performance looks like for each service in terms users would actually care about: Page load time is under three seconds for 99 percent of requests. Search results returned in under 500 milliseconds for 95 percent of requests. The checkout API is available 99.9 percent of the time.
Then you measure whether you’re meeting those targets. If you are, life is good. If you’re not, you have an error budget that’s getting depleted, and your team needs to slow down feature work and focus on reliability.
SLOs are powerful because they shift the conversation from intuition to data. Instead of arguing about whether the site is “slow” or whether the service is “stable,” you point at a number. The SLO says 99.5 percent. We’re at 98.9 percent this month. Here’s what’s been eating the budget.
Most modern observability platforms have built-in SLO tracking. Grafana has SLO dashboards. Sloth is an open source tool specifically for managing SLOs against Prometheus metrics. The setup work is real but pays off enormously in clearer prioritisation conversations.
The role of automation
Observability alone doesn’t keep a data centre running. People do, with the help of automation. A modern operations setup typically includes a lot of automated responses to common problems.
If a host goes unhealthy, it gets drained and replaced automatically. If a service is using too much memory, it gets restarted. If traffic in one region spikes, additional capacity gets provisioned. If a deployment causes elevated error rates, it gets rolled back without human intervention.
None of this automation works without good signals. The automation needs to know what healthy looks like, what unhealthy looks like, and how confident it is in the diagnosis. The metrics, logs, and traces are the foundation that lets automation make these decisions safely.
Tools like Kubernetes already do a lot of this out-of-the-box. Liveness probes restart unresponsive containers. Readiness probes prevent traffic from reaching containers that aren’t ready. Horizontal pod autoscalers scale workloads based on metrics like CPU usage or custom application metrics. The basic plumbing for self-healing is increasingly part of the platform itself.
For more sophisticated responses, teams build runbook automation. When alert X fires, run procedure Y. Tools like Rundeck, StackStorm, or even simple webhook-driven systems can handle a lot of routine remediation without waking anyone up.
The best operations teams I’ve worked with treat their on-call experience as a backlog. Every page in the middle of the night becomes a ticket. The ticket asks: Can we prevent this from happening again, or can we make the response automatic? Over months and years, the noisiest alerts get fixed or automated away, and the on-call experience becomes genuinely sustainable.
What good dashboards look like
A dashboard is not a list of every metric you have. A dashboard is a story. It should answer specific questions in a clear order.
For most services, I’d start with what the SRE community calls the four golden signals. Traffic, errors, latency, and saturation. Traffic tells you how busy the service is. Errors tell you whether it’s failing. Latency tells you how fast it is. Saturation tells you how close to its limits it’s running.
If those four signals look healthy, the service is almost certainly fine. If any of them is off, you have a clue about where to look next.
Beyond the golden signals, your dashboard should include the specific things that matter for that service. Queue depth for a queue worker. Cache hit ratio for a cache. Number of active connections for a database. Whatever the specific health indicators are.
What I would not put on a top-level dashboard is everything you can possibly measure. If the dashboard has a hundred panels, nobody will actually look at it during an incident. They’ll get overwhelmed and click away. A good dashboard fits on one screen. It tells you in five seconds whether things are okay. If they’re not, it gives you the next place to click.
The hidden cost of telemetry
Let me say something that vendors won’t. Observability is not free, even when the tools are open source.
Every metric you collect costs storage. Every log you ship costs bandwidth and storage. Every trace you sample costs both. At a small scale, this is invisible. At a large scale, it can become enormous. I’ve seen teams whose observability bill rivalled their compute bill. Not because they were doing anything wrong, just because they were collecting everything from everywhere and never going back to ask if they actually used it.
The discipline that helps here is the same discipline that helps with code. Be intentional. Sample wisely. Aggregate where you can. Set retention policies that match how long you actually need the data. Most teams need full-fidelity data for a few days for incident investigation, lower-resolution data for a few months for trend analysis, and almost nothing beyond that.
A good practice is to periodically audit what you’re collecting and ask, when did we last query this. If a metric has not been looked at in six months, it’s probably safe to stop collecting. The same goes for logs and traces.
Common patterns that catch people out
There are a few mistakes I’ve watched teams make repeatedly when building out observability.
Alerting on causes instead of symptoms. CPU at 90 percent is a cause. Users seeing slow page loads is a symptom. The on-call engineer should be paged for the symptom. The cause is something they investigate after waking up. Pages on causes generate enormous noise because causes don’t always lead to symptoms. A box can sit at 90 percent CPU all day with nobody noticing, because the service is still fast.
Building too many dashboards. Every team adds dashboards. Few teams remove them. Within a year, you have hundreds of dashboards, of which maybe ten are actually used. Be ruthless. Delete what isn’t used. Mark canonical dashboards clearly so people don’t get lost.
Treating observability as an afterthought. The teams that struggle most are the ones that try to add observability to a system that wasn’t built with it in mind.
Confusing logging with observability. Just because you have a log aggregator doesn’t mean you have observability. Logs are part of the picture. Metrics and traces complete it. A system with brilliant logging and no metrics is going to struggle to answer basic questions like “how busy is this service right now.”
Where the field is moving
A few things worth keeping an eye on.
OpenTelemetry has won as the standard for emitting telemetry. If you’re starting a new project today, instrument it with OpenTelemetry and you’ll be able to swap backends without changing your application code. That portability used to be hard. Now it’s the default.
eBPF is changing what observability can see. Tools like Pixie, Parca, and Cilium Hubble can see inside running applications without modifying them at all. Network calls, function executions, system calls, all visible. It’s still maturing, but the visibility is genuinely new.
AI-assisted incident response is starting to actually work. Tools that ingest your telemetry and either help you investigate, suggest likely root causes, or auto-summarise incidents are getting useful. Not magic, but useful.
Cost-aware observability is becoming a discipline of its own. As organisations realise how much they’re spending on telemetry, tools that help you understand the cost-value of each metric, log, or trace are emerging. Expect this to become a more prominent topic in observability conversations.
What a sensible starting point looks like
If your organisation is just starting to build out observability seriously, here’s a path I’d suggest.
Start with metrics. Install Prometheus. Get Node Exporter on every server. Get your applications to emit basic metrics about request volume, error rates, and latency. Build a dashboard that shows the four golden signals for each major service. This alone gives you 80 percent of the value with 20 percent of the effort.
Add structured logging next. Switch your applications to emit JSON logs. Ship them to a central log store, whether that’s Loki, Elastic, or a managed service. Add request IDs to every log so you can correlate events later.
Then introduce tracing. Instrument your services with OpenTelemetry. Get traces into Jaeger or Tempo. Train your team to read trace waterfalls. The day someone uses traces to find a latency problem that would have taken hours with logs alone is the day everyone becomes a believer.
Finally, formalise your SLOs. Pick one or two for your most critical user journeys. Track them. Use them to drive prioritisation conversations. This shifts how the team thinks about reliability.
You don’t have to do all of this at once. You don’t have to do it perfectly. The teams I admire most are the ones who iterated on their observability for years and ended up with something genuinely powerful, not the ones who tried to design it all up front and got stuck in analysis paralysis.
The quiet work that keeps things running
The truth nobody puts on a billboard is that a modern data centre is held together by an enormous amount of careful, unglamorous, mostly invisible work. The dashboards nobody screenshots. The alerts that fire and resolve themselves before anyone notices. The runbooks updated after an incident. The weird metric somebody added two years ago that turned out to save a Friday evening. None of it makes the keynote. All of it matters. If you ever find yourself wondering why your favourite streaming service worked perfectly last night despite a regional outage, or why your bank’s app didn’t blink during a record traffic spike, the answer is almost always the same. Somewhere, a team that you’ll never meet built the observability that caught the problem early and acted before it got loud. Take a moment to appreciate that. Then go build a little more of it yourself.